
HeatmapR draws complex, publication-ready heatmaps in R. It handles everything from a quick look at a table to clustered heatmaps of hundreds of thousands of cells. Dendrograms, annotations and legends are laid out for you, and there are dot plots and other plots for single-cell data. It is fast enough for single-cell data, needs nothing beyond R to install, and comes with an app to build heatmaps in the browser. Visit the website to get started.
Why HeatmapR?
-
Much faster, with a fraction of the memory. Clustering and drawing a heatmap of 20,000 rows takes 0.6 seconds and 114 MB. pheatmap,
heatmap.2(),stats::heatmap()and ComplexHeatmap take 32 seconds to 2 minutes and 3.3 to 4.7 GB. HeatmapR clusters large data in two stages by default; clustering exactly, as the others do, it takes 7.1 seconds and 1.5 GB. A 3,000 × 3,000 matrix takes 4 seconds instead of over 4 minutes. 100,000 rows take 1.2 seconds, where every other package ran out of memory. -
Built for single-cell data.
heat_map()takesSingleCellExperiment,Seurat,flowSetand AnnData data as they are, as well as sparse and on-disk matrices. Features are chosen by name, and cells are grouped and annotated by their metadata. There are also dot plots, markers, gene-set scores, compositions, contrasts and trajectories. A heatmap of 40 genes in 100,000 cells takes 1.3 seconds, against 40 seconds and 2.8 GB with Seurat’sDoHeatmap(). -
Complete figures from one call. Dendrograms, cluster splits, annotation tracks, bar plots, labels and legends are sized in inches from their contents. They’re laid out so that nothing overlaps, whatever the shape of the data or the size of the image, and
heat_map_save()writes the figure at print resolution. -
Point, click and keep the code.
heat_map_app()builds heatmaps in the browser and writes the R code that draws them again.heat_map_html()turns any heatmap into a web page to explore: hover for values, select rows and columns, search and zoom. -
Ready for publication and analysis.
-
heat_map_describe()writes alternative text for screen readers. -
heat_map_check_colours()finds colours that colour-blind readers can’t tell apart. -
heat_map_info()returns the order and clusters of the rows and columns for the rest of your analysis.
-
- Nothing else to install. HeatmapR uses base graphics and compiled C++, with no dependencies beyond R. pheatmap installs 13 other packages, ComplexHeatmap 18 and Seurat 129. HeatmapR is MIT licensed.
HeatmapR and the alternatives
Time to draw a heatmap, in seconds, and the peak memory for 20,000 rows:
| HeatmapR | pheatmap | ComplexHeatmap | heatmap.2() |
stats::heatmap() |
|
|---|---|---|---|---|---|
| Clustered, 20,000 × 30 | 0.6 (exact: 7.1) | 32 | 130 | 48 | 45 |
| Peak memory, 20,000 × 30 | 114 MB (exact: 1.5 GB) | 4.7 GB | 3.7 GB | 4.7 GB | 3.3 GB |
| Clustered, 3,000 × 3,000 | 3.7 | 254 | 275 | 253 | 249 |
| Clustered, 100,000 × 30 | 1.2 | out of memory | out of memory | out of memory | out of memory |
| Not clustered, 3,000 × 3,000 | 0.6 | 8.8 | 26 | 250 | 4.5 |
| Other packages installed | 0 | 13 | 18 | 3 | 0 |
For single-cell data, against Seurat and scran:
| HeatmapR | Seurat or scran | |
|---|---|---|
| Heatmap of 40 genes in 100,000 cells | 1.3 s | 40 s, 2.8 GB (DoHeatmap()) |
| Dot plot of 40 genes in 100,000 cells | 0.17 s | 1.9 s (DotPlot()) |
| Markers of 12 groups, 20,000 cells and 20,000 genes | 0.4 s | 19 s (scran’s scoreMarkers()) |
All times were measured on two cores with 7.8 GB of memory. For small heatmaps, every package takes about a tenth of a second, except ComplexHeatmap at about two seconds. The methods, and every size measured, are in the speed comparison and the single-cell guide. The numbers of packages are for the versions compared there.
Features
Beyond clustering, scaling and customisable colours, shapes, sizes, text, legends and layouts, HeatmapR can:
-
Show more than one value in each cell:
- split cells to compare two conditions (
cell_split); - show the distribution of the values behind each cell (
cell_values); - use cell size as a second variable;
- fade colours towards grey where values are uncertain (
cell_uncertainty).
- split cells to compare two conditions (
-
Annotate rows and columns:
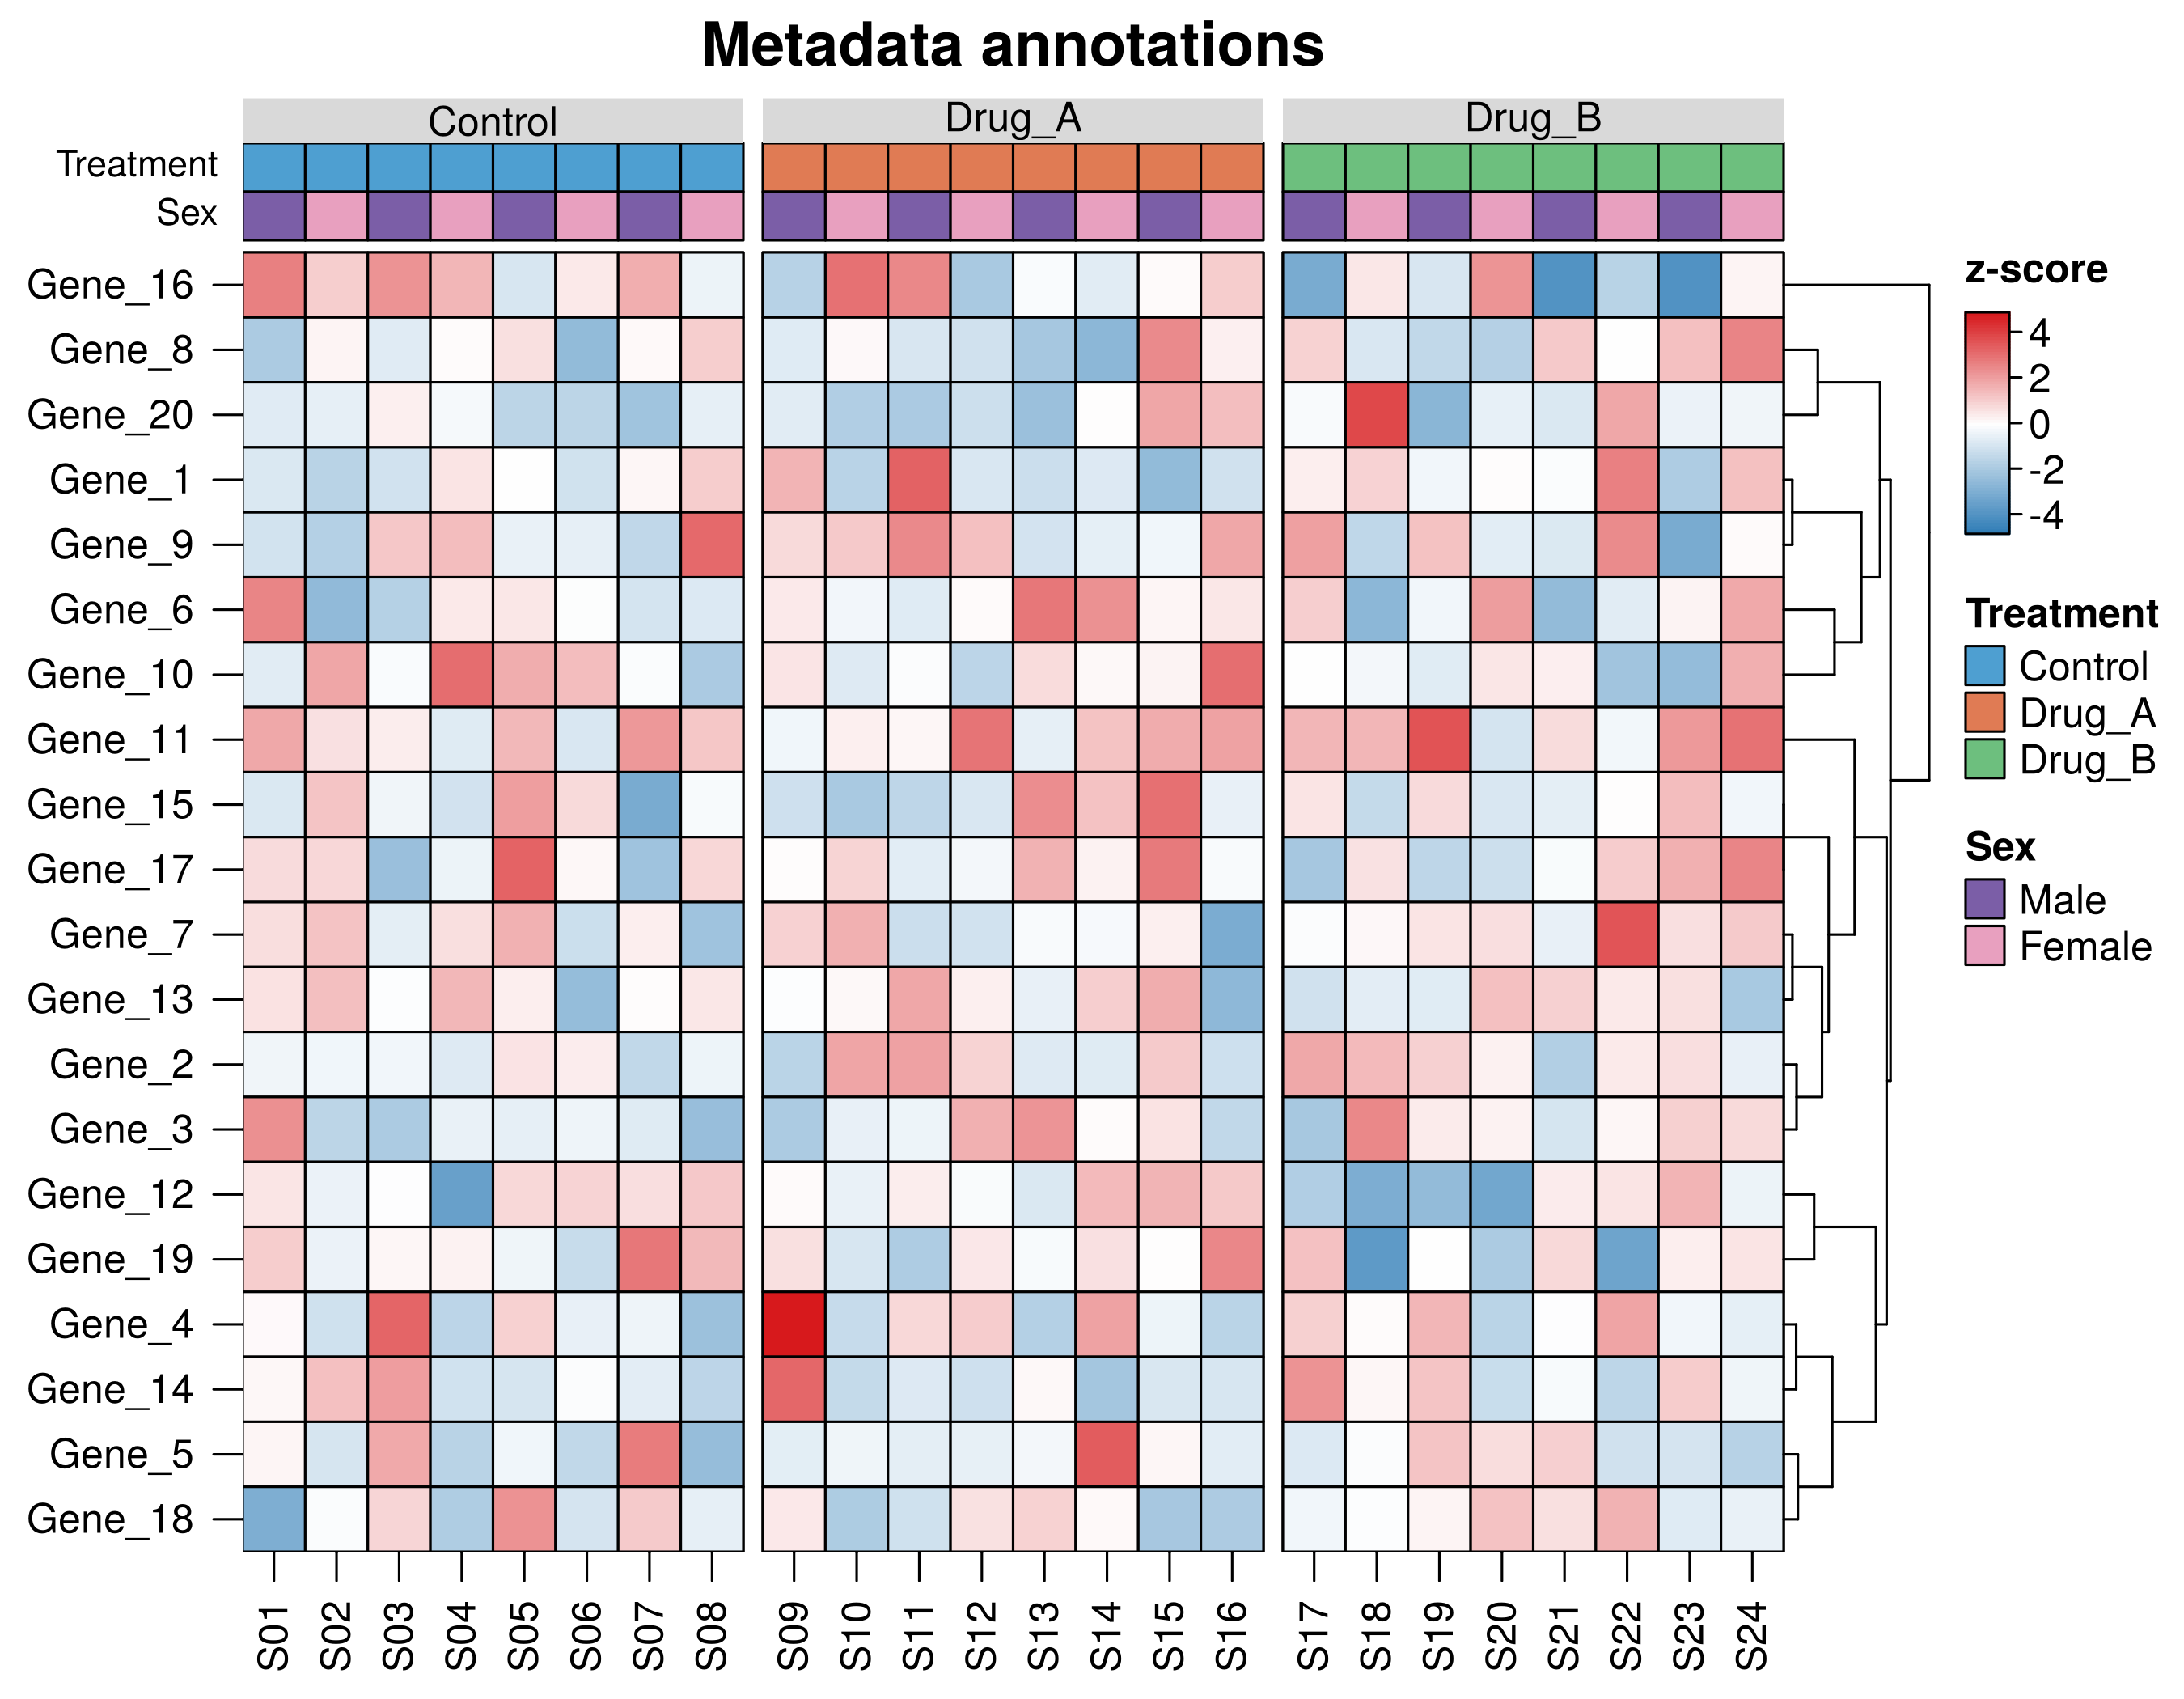
- metadata tracks (
annotation_x,annotation_y); - bar graphs, box plots and violins beside the heatmap;
- labels for chosen rows of a large heatmap (
mark_y); - a zoom lens that enlarges a band of rows beside the whole (
zoom_y).
- metadata tracks (
-
Cluster with confidence:
- correlation and cosine distances;
- optimal leaf ordering;
- clustering within your own groups;
- k-means splits;
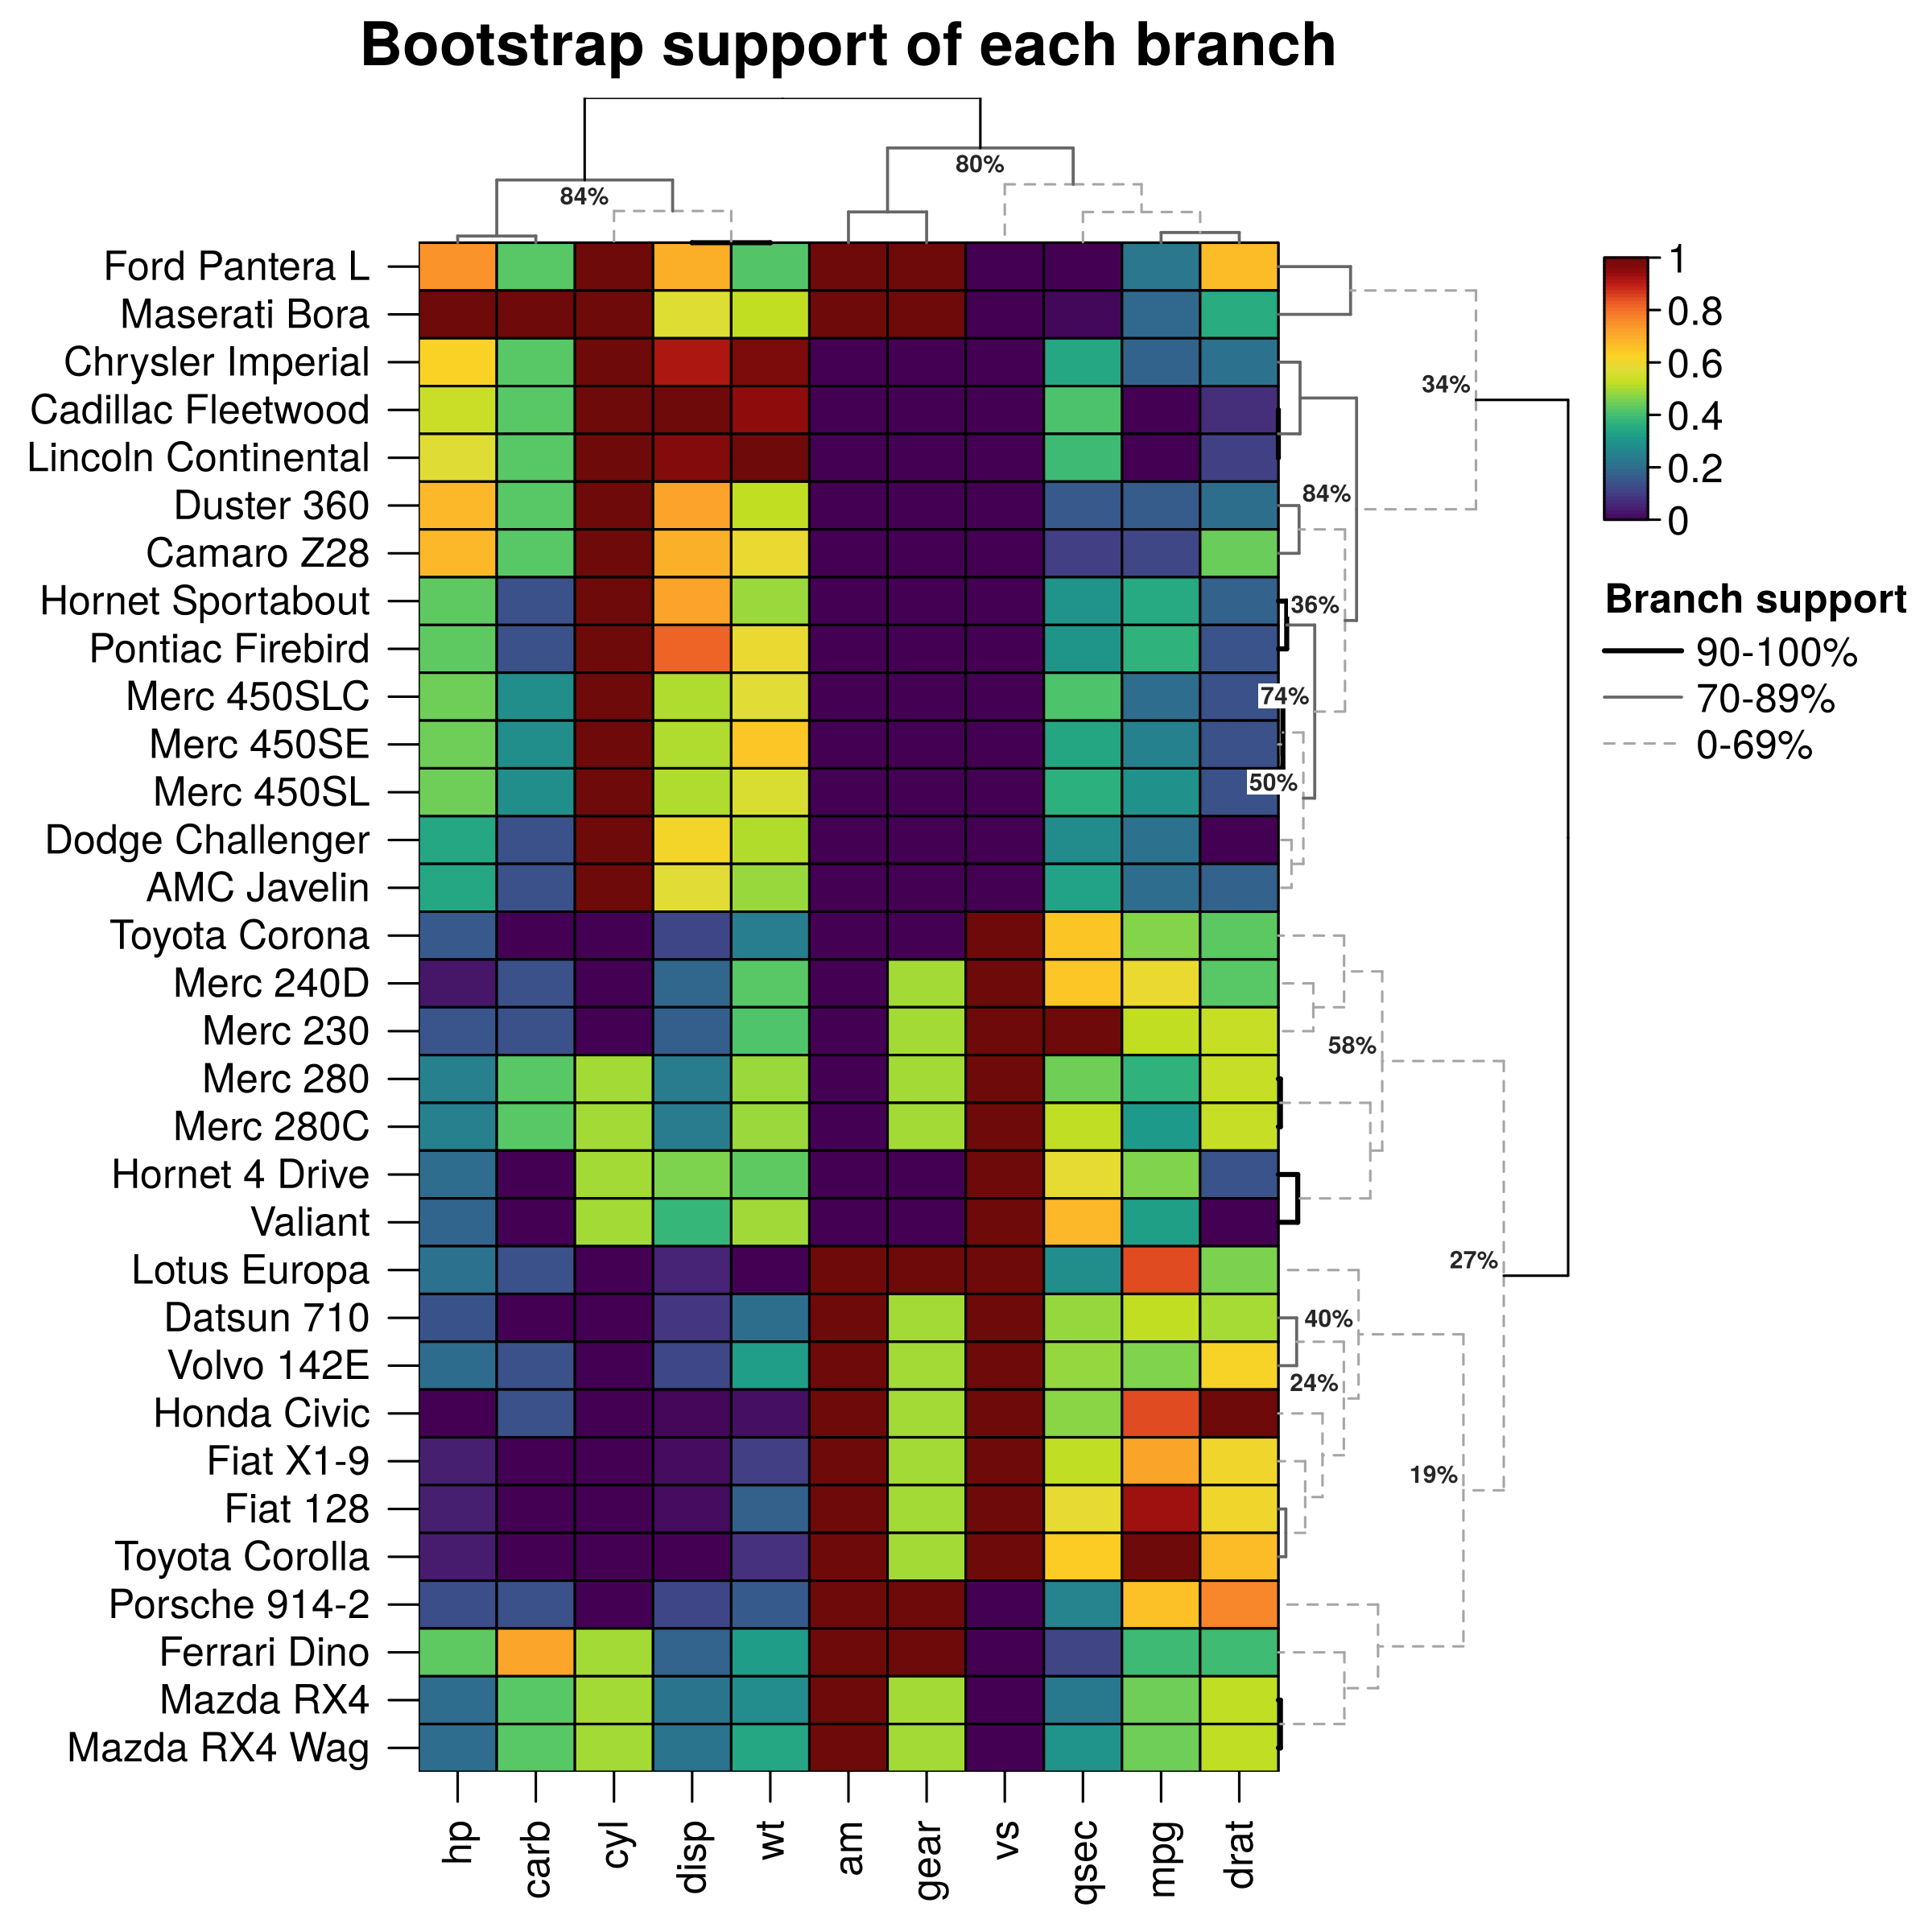
- bootstrap support drawn on the dendrogram branches (
tree_support_y).
-
Handle large data:
- raster images for heatmaps with millions of cells;
- two-stage clustering for a million rows;
-
heat_map_summarise()for pseudobulk heatmaps and dot plots of groups of cells; - robust, stepped or centred colour scales, with the distribution of the values traced over the legend.
-
Work with ggplot2:
-
heat_map_grob()places heatmaps besideggplot2plots inpatchworkandcowplotlayouts; -
heat_map_data()returns the cells, rows, columns and dendrograms as tidy data, for rebuilding or restyling them.
-
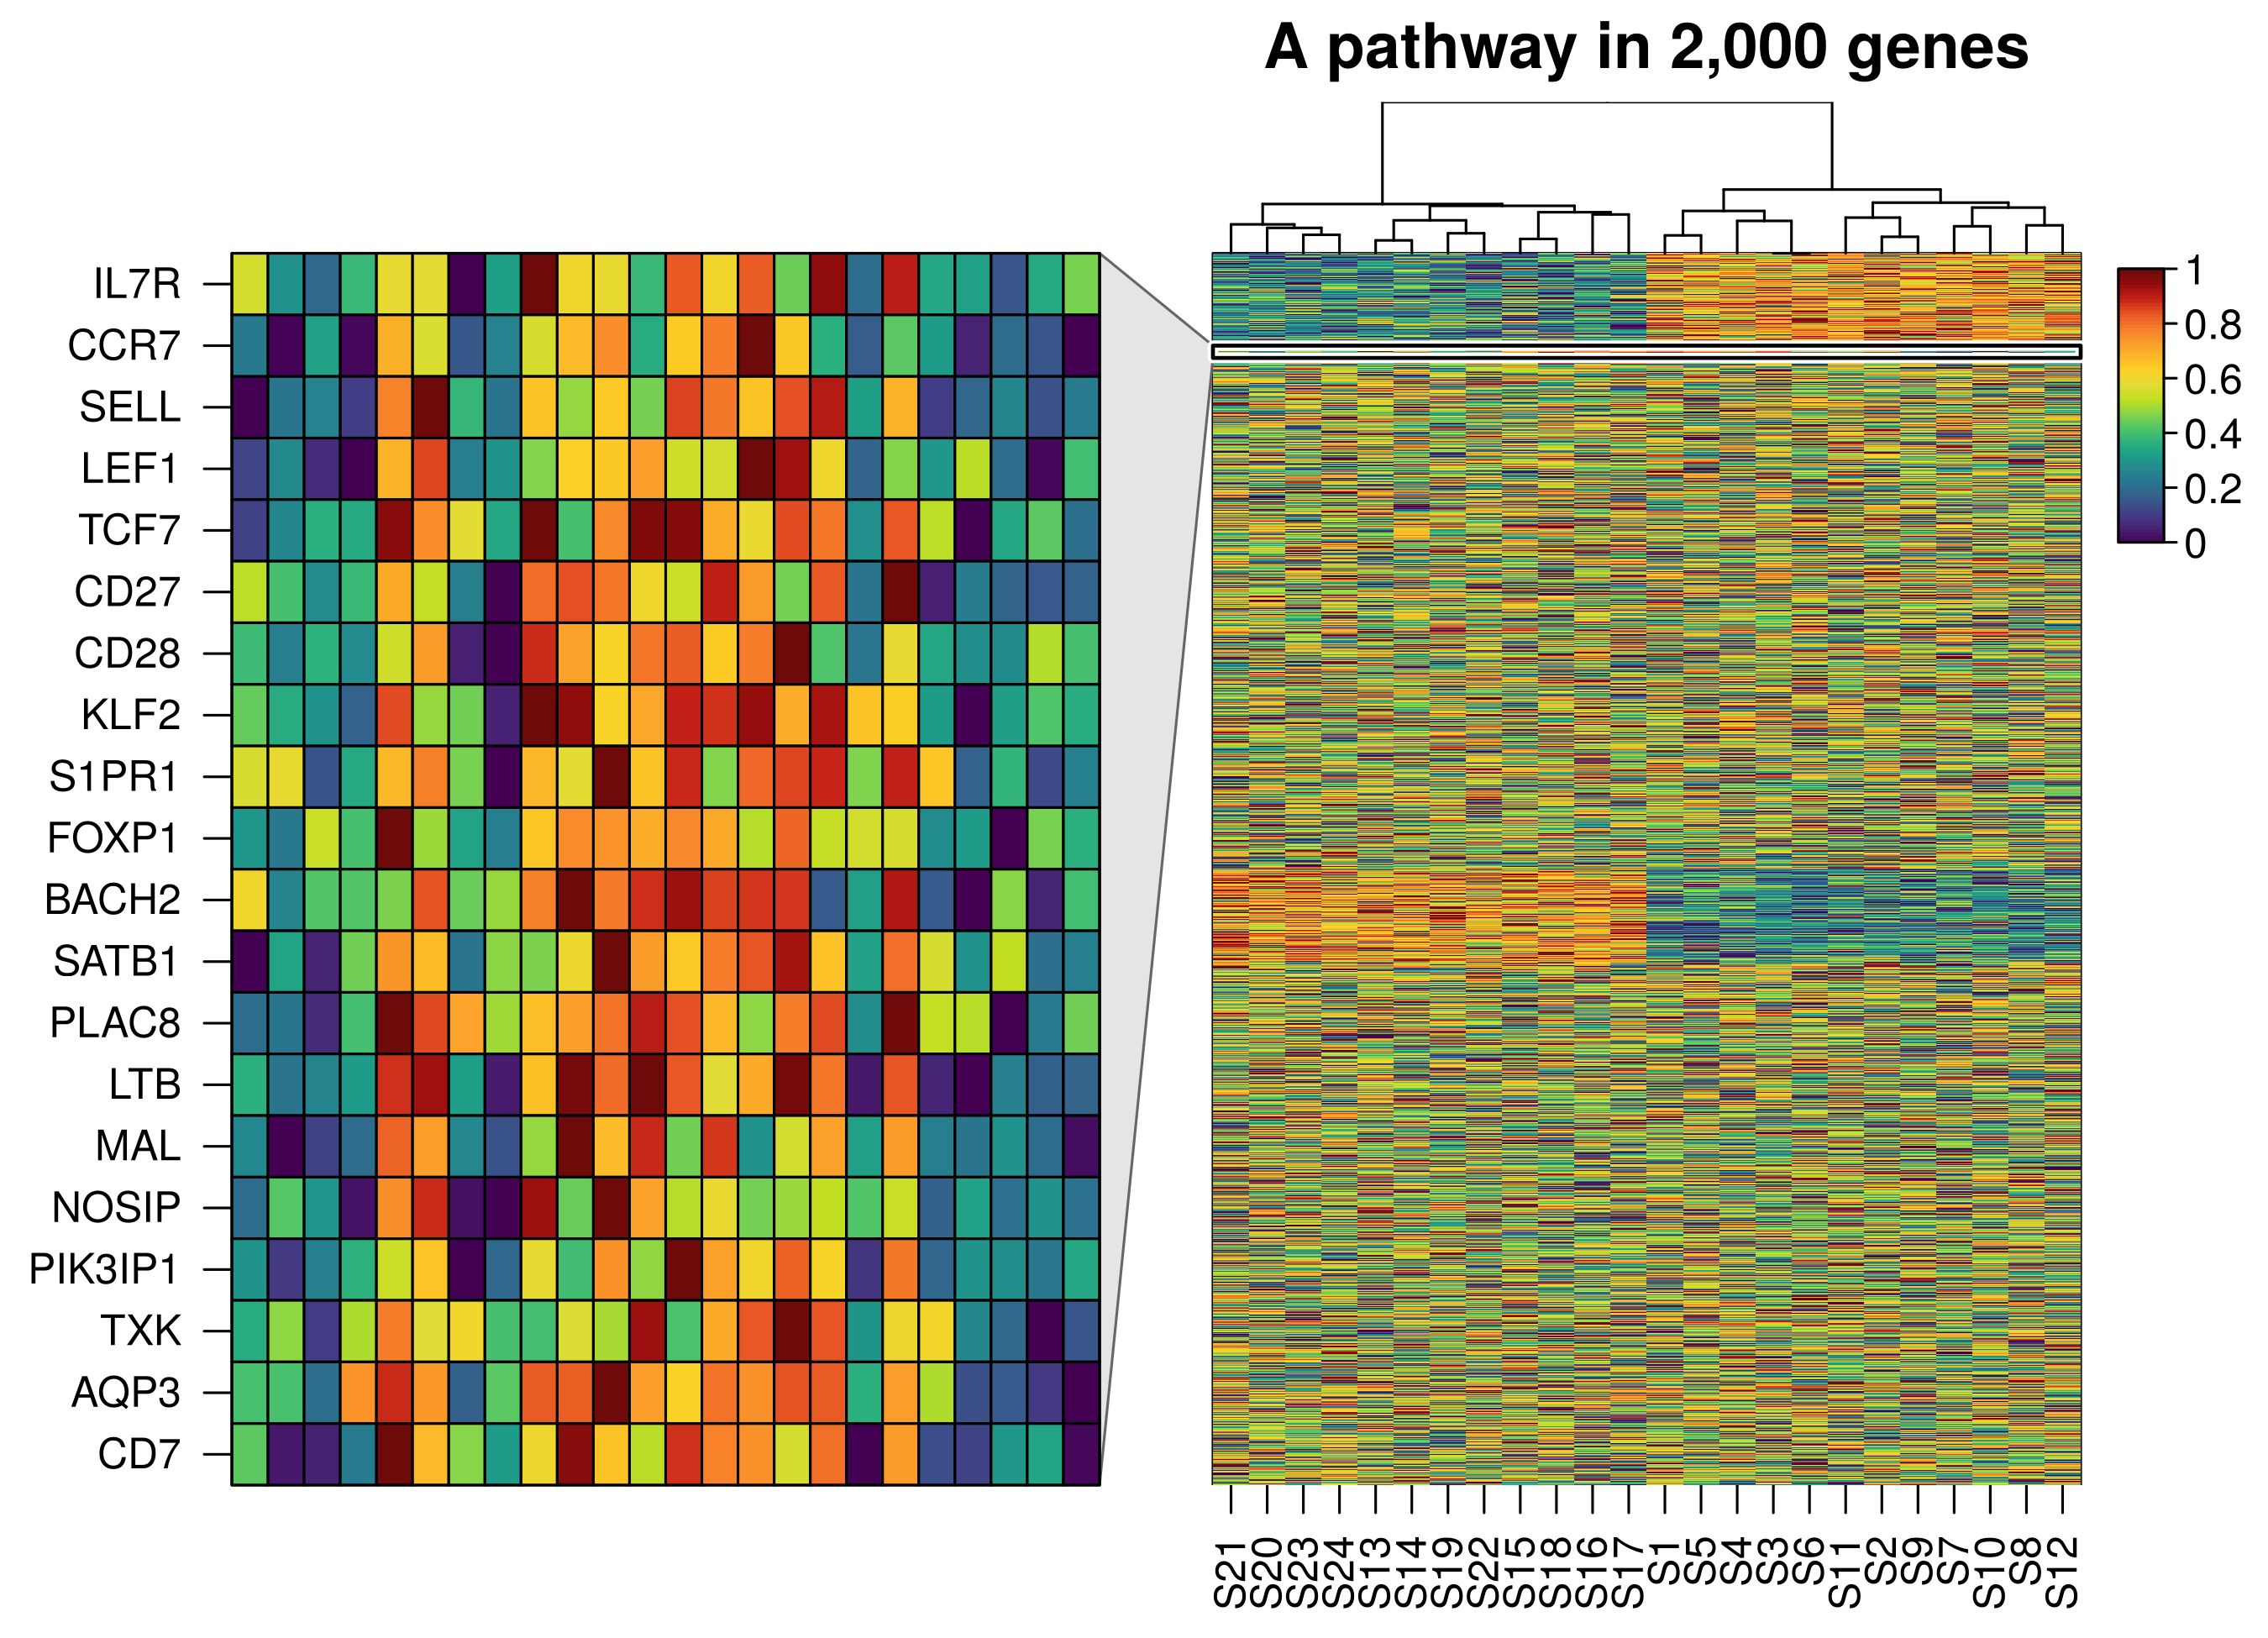 Zoom lens |
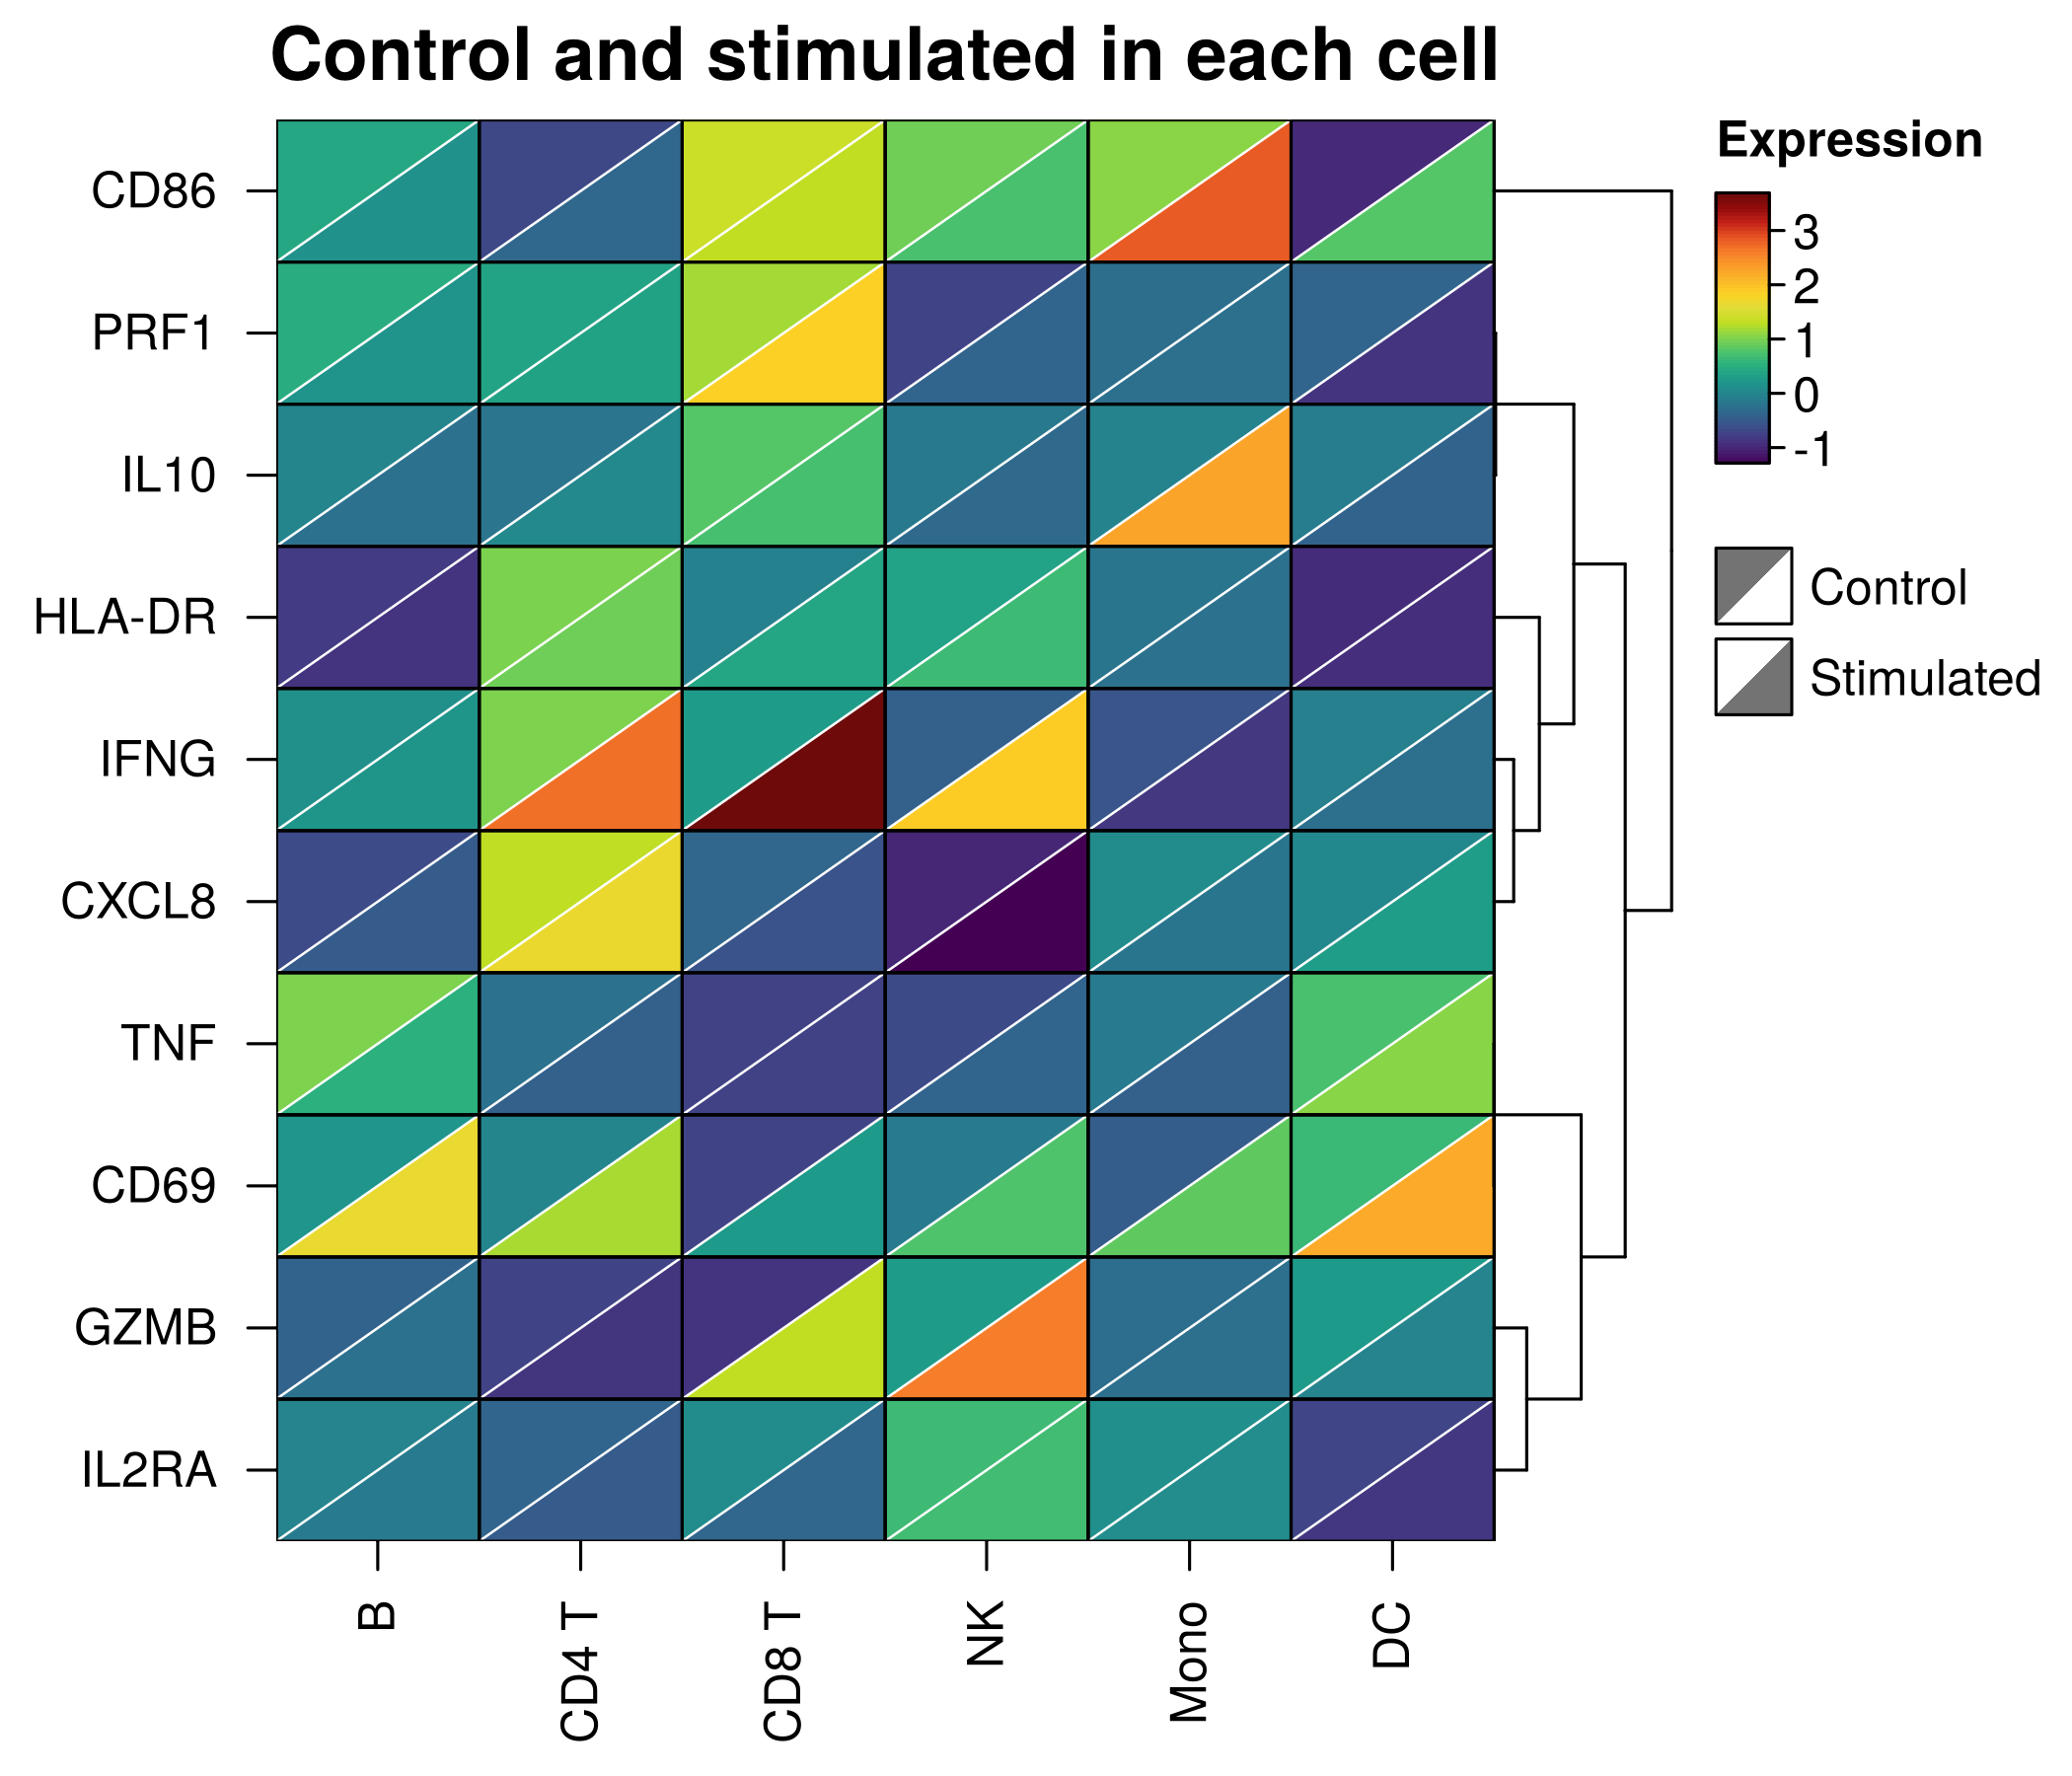 Split cells |
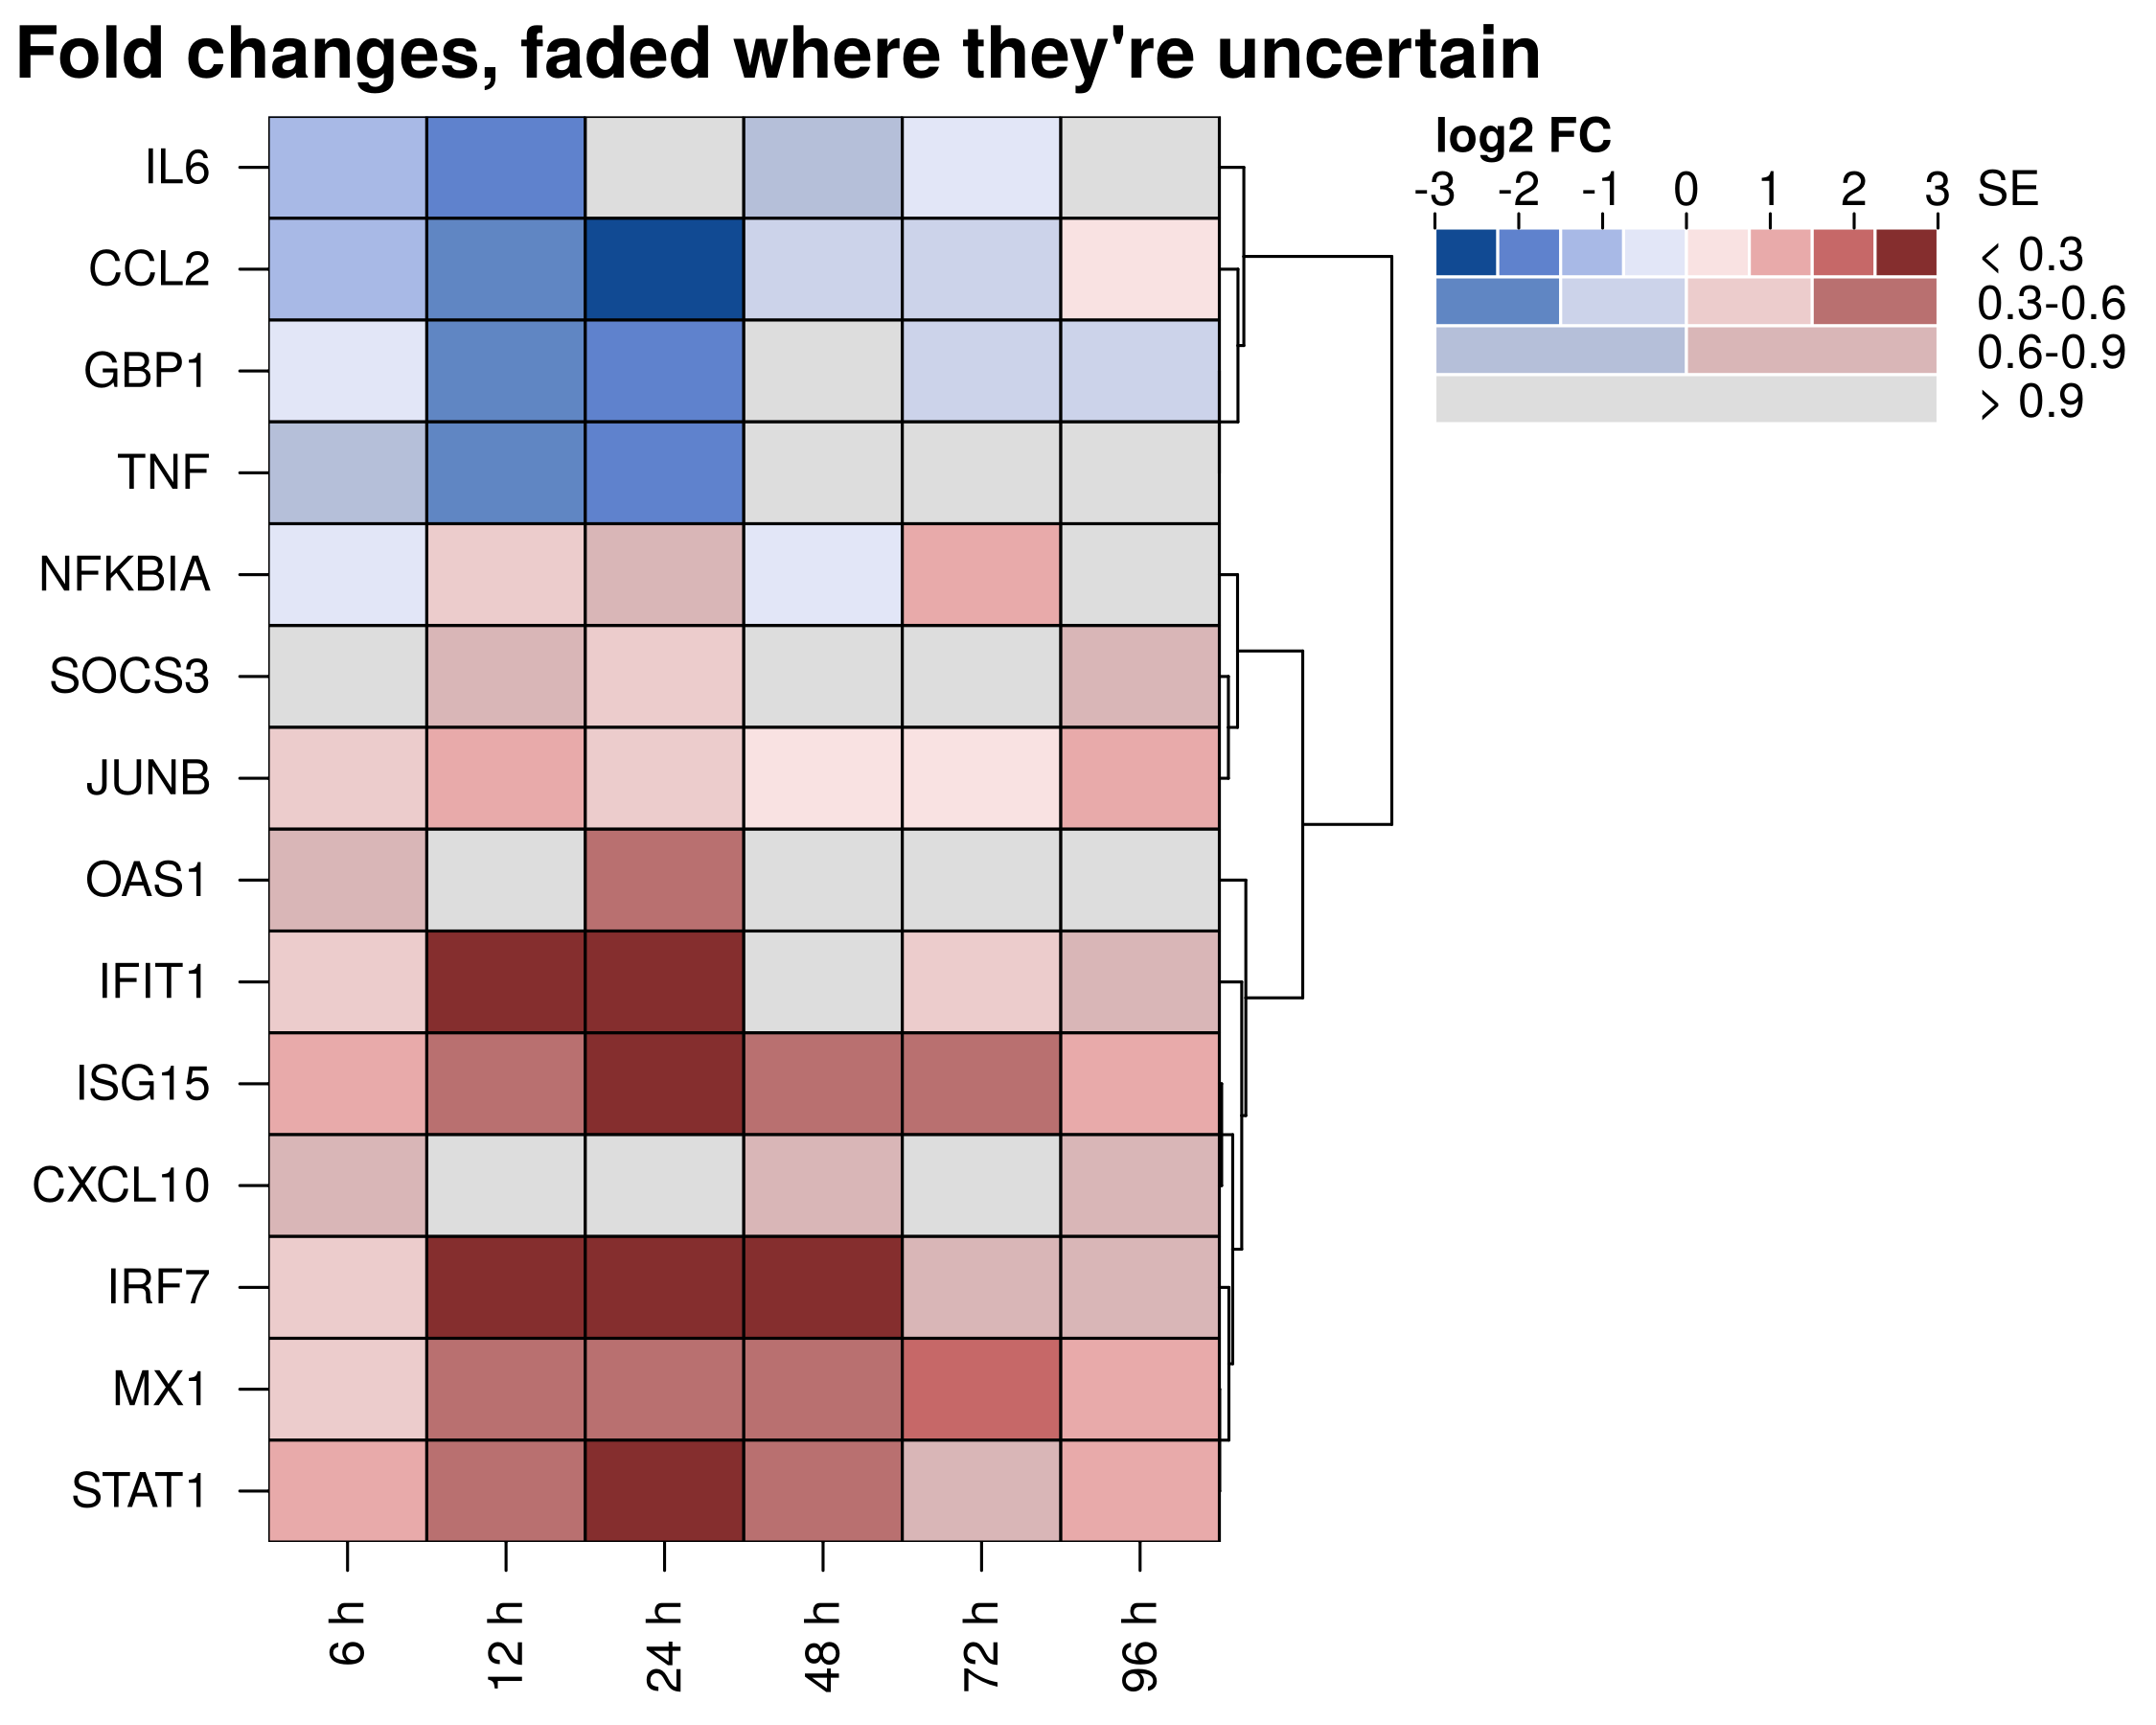 Uncertainty in colour |
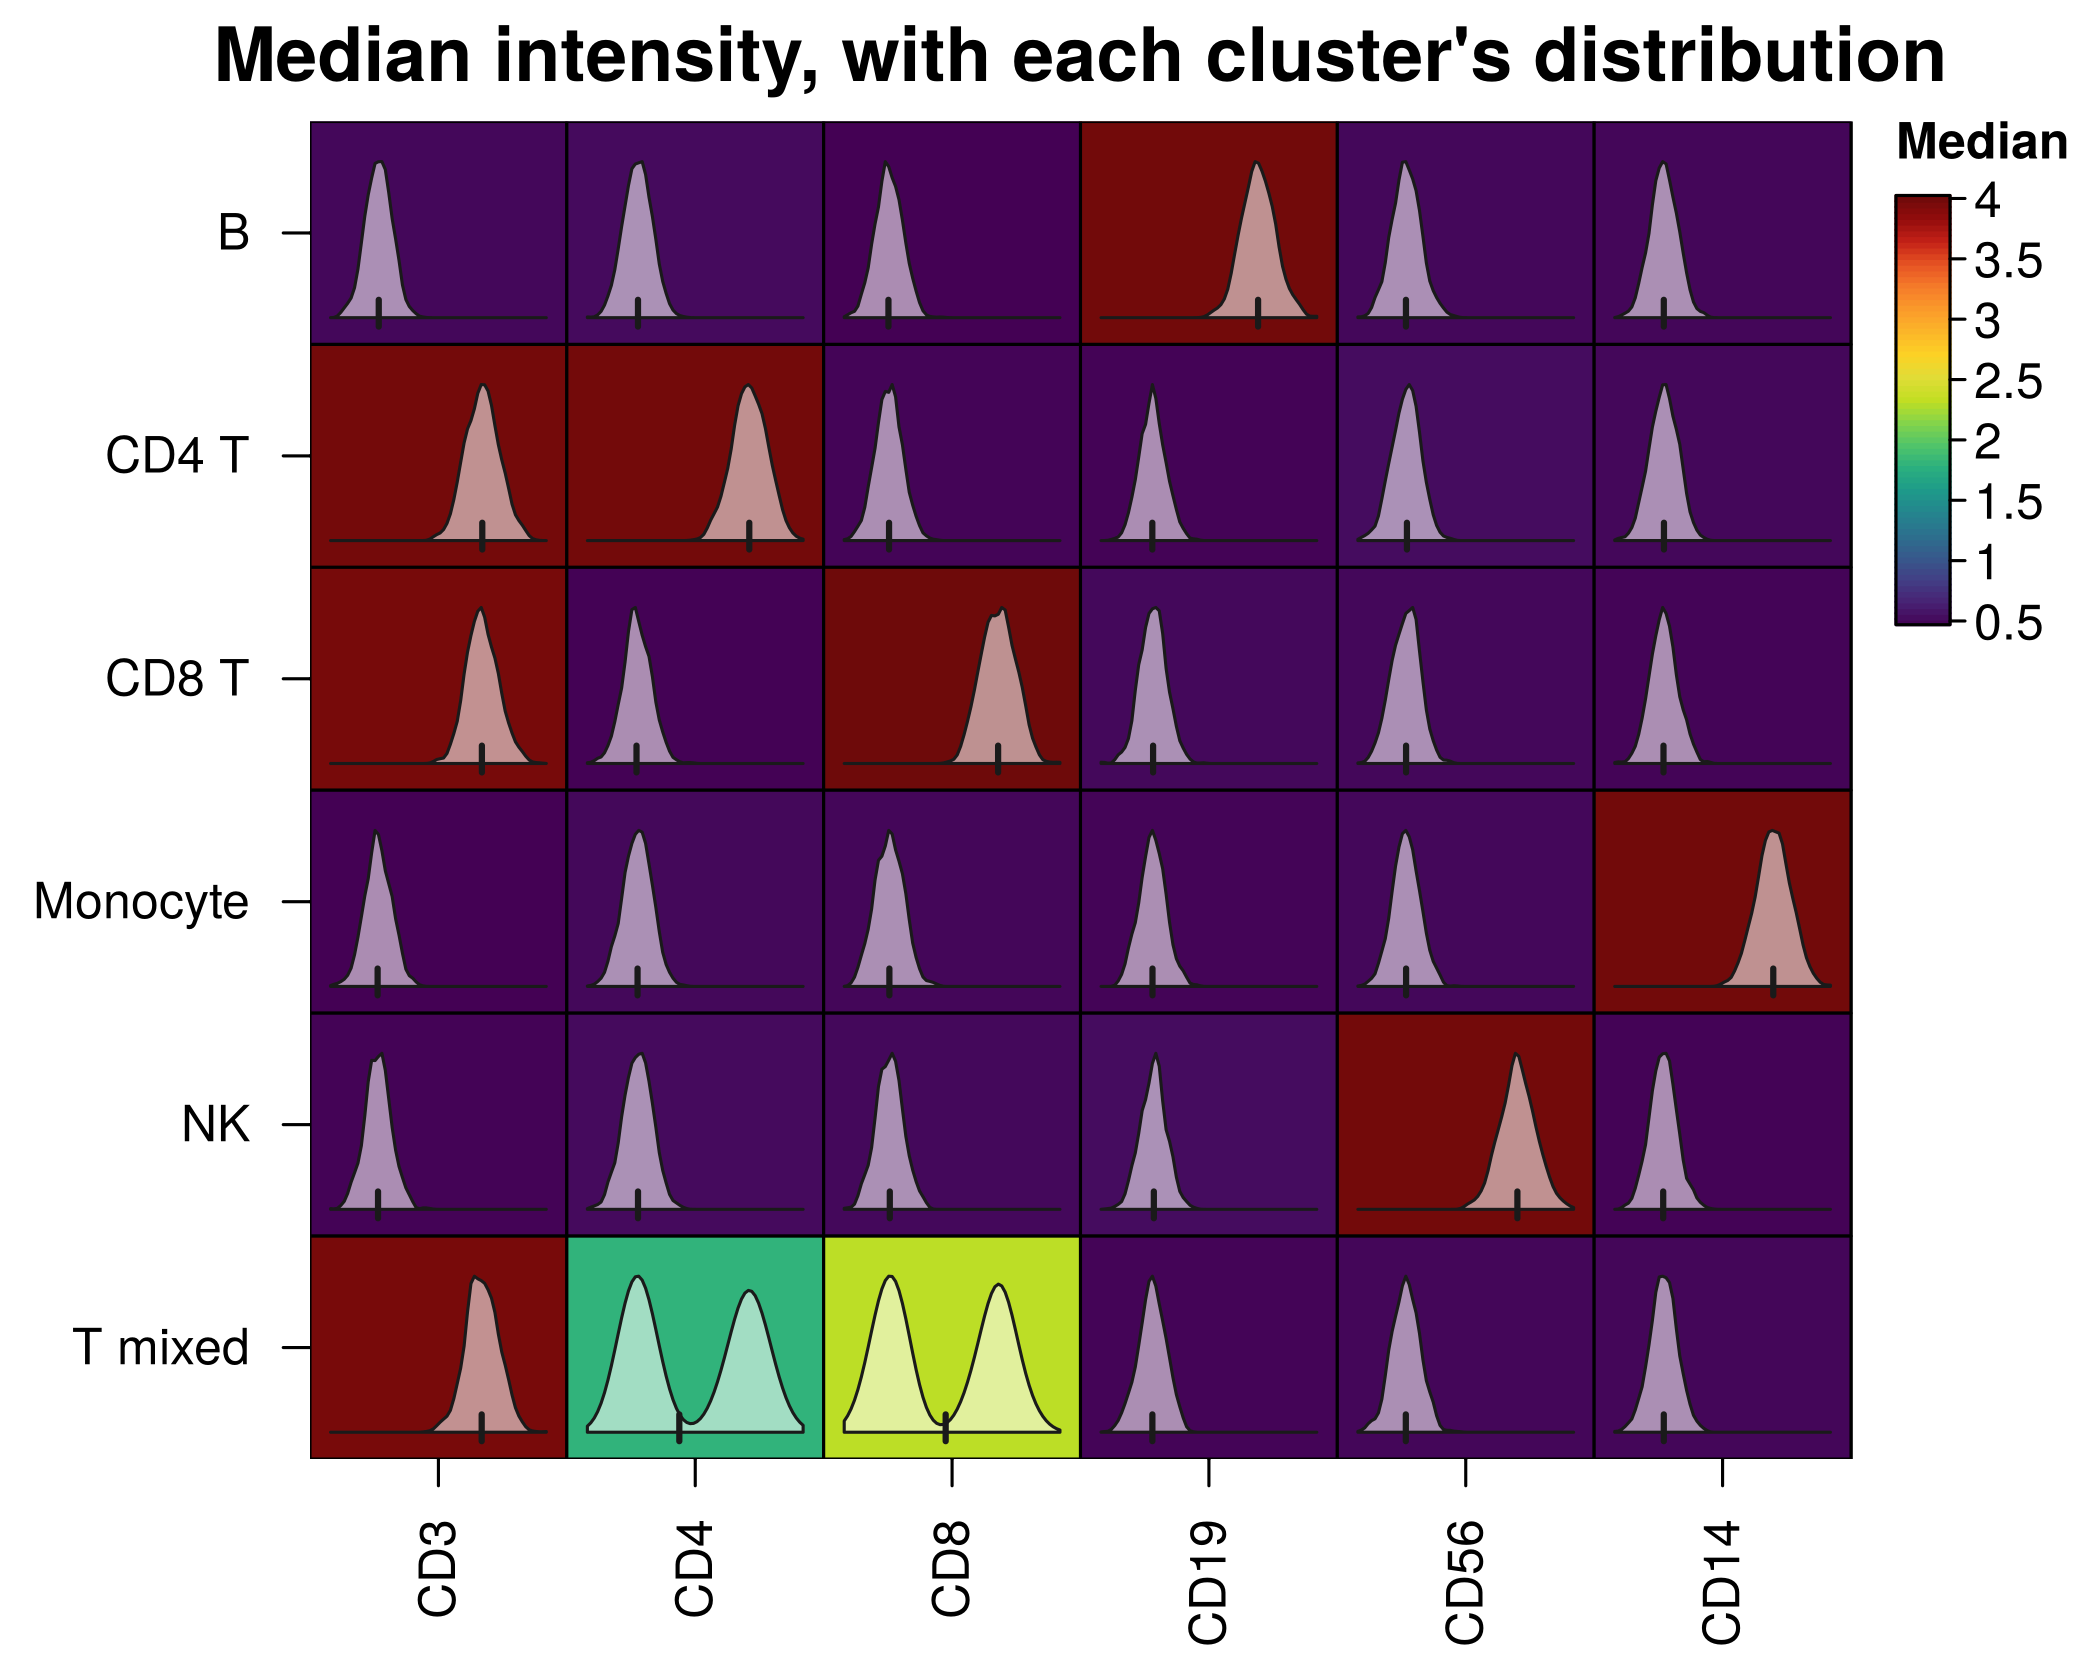 Distributions inside cells |
 Branch support |
 Metadata annotations |
Build heatmaps in the browser
heat_map_app() opens an app to build a heatmap without writing code. You can drop a table or a single-cell file on it, or start it from data in R. Then:
- choose a heatmap, a dot plot or a correlation heatmap;
- set any argument of
heat_map()while the heatmap redraws, with values on hover and selections on the heatmap; - download the figure, with the R code that draws it again.
It needs the shiny and bslib packages. Building heatmaps in the browser shows how it works.
heat_map_app()                                         # drop a file, or choose an example
heat_map_app(mtcars, scale = "column", tree = "both")  # start from data in R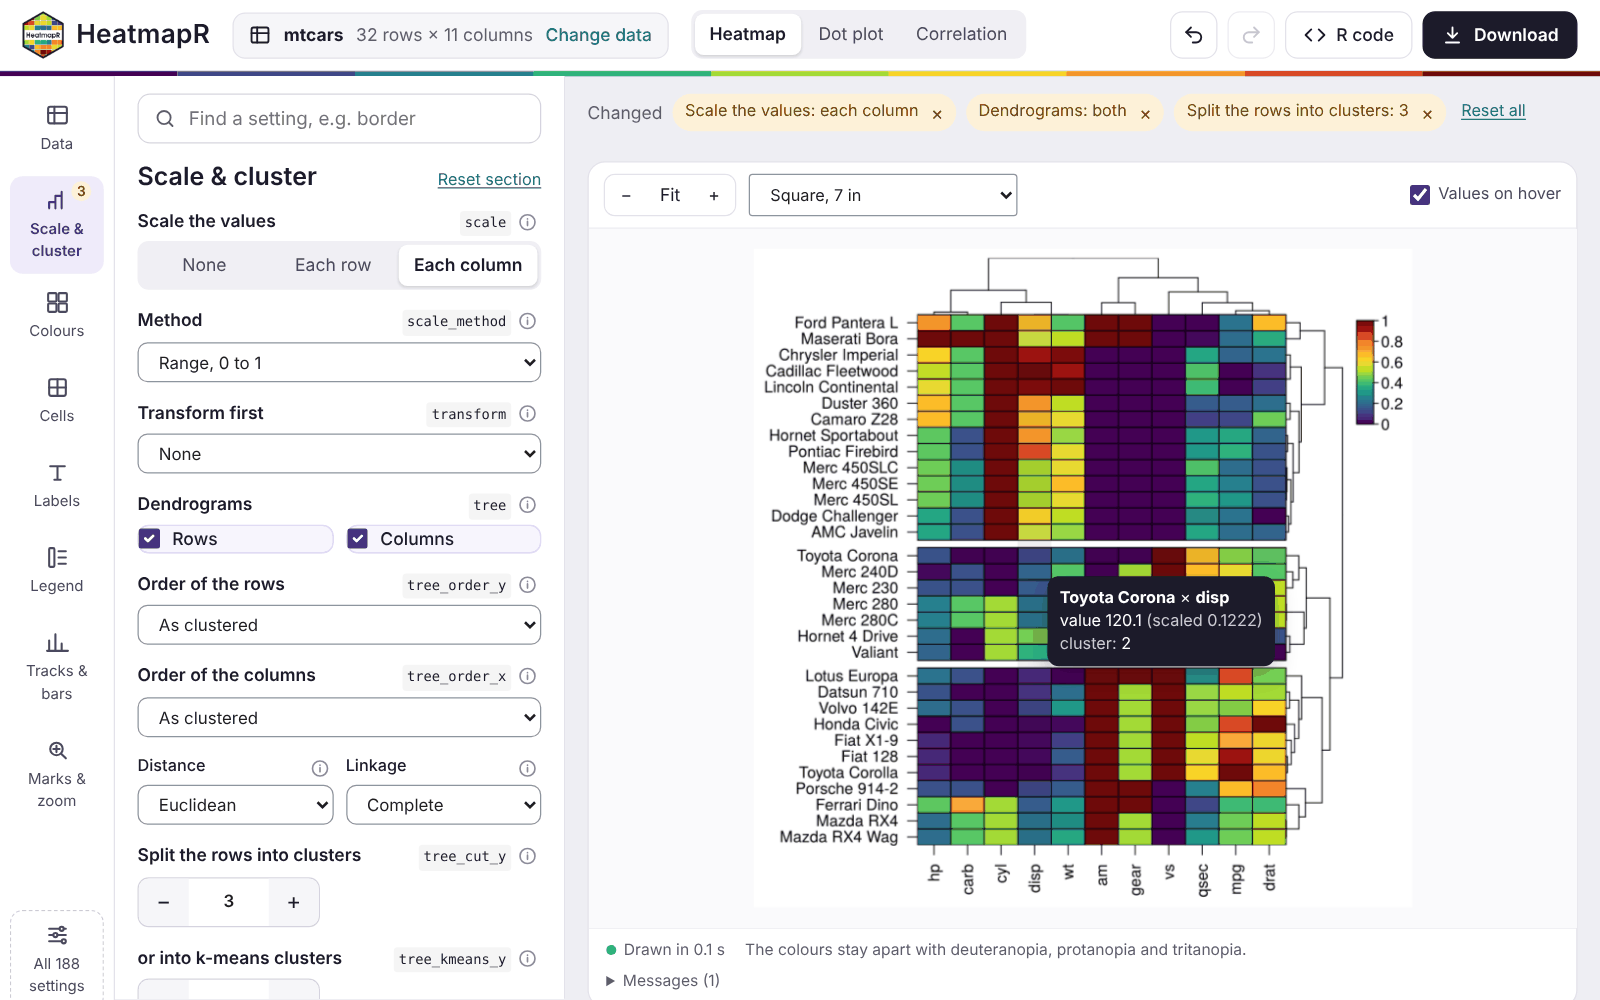
heat_map_html() writes any heatmap as a single web page that works without R. Hover for values; click or drag over cells, labels and dendrograms to select rows and columns; then copy or download the selection, search and zoom.
Single-cell data
HeatmapR reads single-cell data where it lives - SingleCellExperiment and Seurat objects, flowFrame and flowSet objects, AnnData (.h5ad) files and sparse matrices, in memory or on disk (DelayedArray, HDF5Array and BPCells) - choosing features by name and grouping and annotating cells from their metadata. Only the chosen features of the cells shown are made dense, so a few markers of a million cells need little memory, and summaries, markers and scores of every gene read on-disk data a block of genes at a time.
-
Dot plots, markers and gene-set scores -
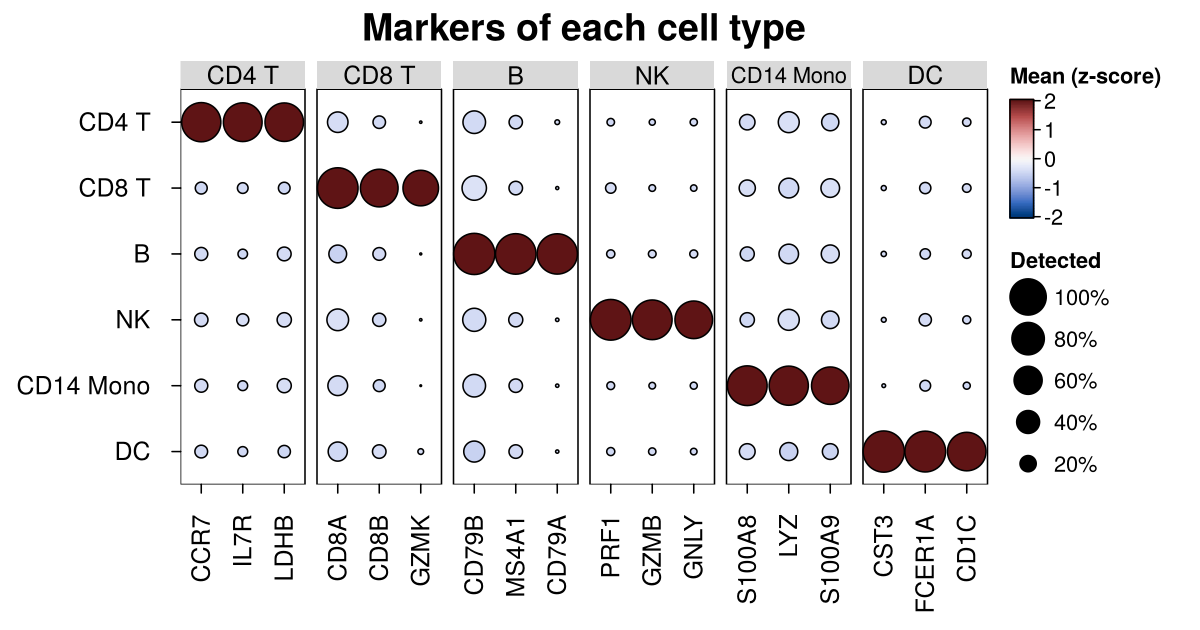
heat_map_dot()draws the mean of each group as colour and the proportion of its cells detected as size (or two conditions in the halves of each dot),heat_map_markers()ranks the markers of each group by their AUC, with Wilcoxon p-values, ready to pass tofeaturesor to draw as a dot plot, andheat_map_score()scores each cell for sets of genes (z-scored means or module scores). -
Compositions and contrasts -
heat_map_composition()draws the share of each cell type in each sample, andheat_map_contrast()the log fold change between two conditions in each cluster, tested on pseudobulks with the samples as replicates. -
Aligned heatmaps -
heat_map_align()lines up data sets measured on the same cells or groups, such as genes and surface proteins, as blocks of one heatmap, each scaled and coloured on its own with its own legend, with the rows clustered on one of them. -
Summaries of groups -
heat_map_summarise()finds the mean, median, sum or proportion detected of each feature in each group of cells from sparse data in compiled code, andgroup_maxkeeps small groups visible next to large ones. - Cytometry - the asinh transform and quantile scaling of markers, the medians of clusters in each sample, and stacked bars of the events of each condition in each cluster.
-
Trajectories -
heat_map_smooth()smooths genes along pseudotime, one lineage at a time, andtree_order_y = "peak"orders them by when they peak.
heat_map_example() simulates blood cells, cytometry events and a branching trajectory to try them on:
cells <- heat_map_example("rna")
markers <- heat_map_markers(cells, group_by = "cell_type", n = 3)
heat_map_dot(cells, features = markers, group_by = "cell_type")
 Dot plots |
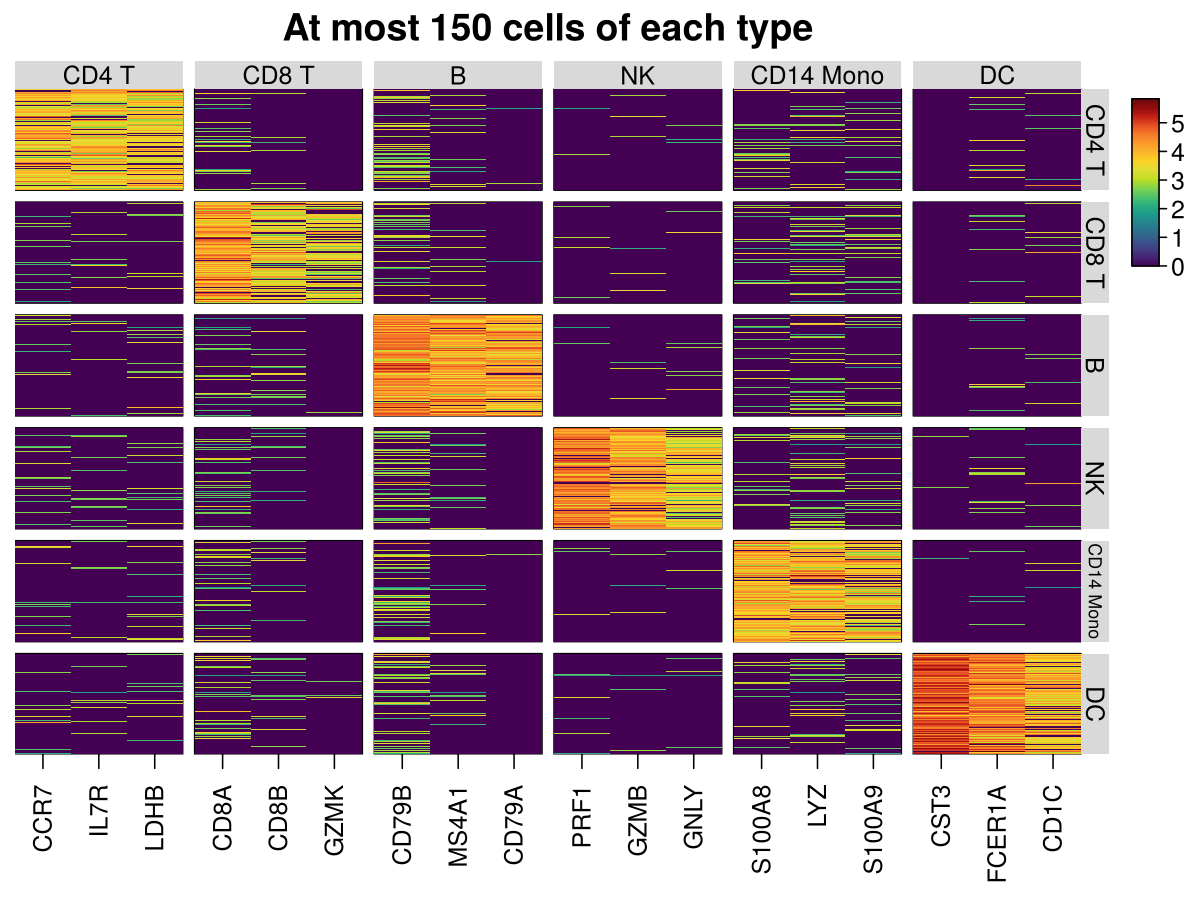 Markers of each group |
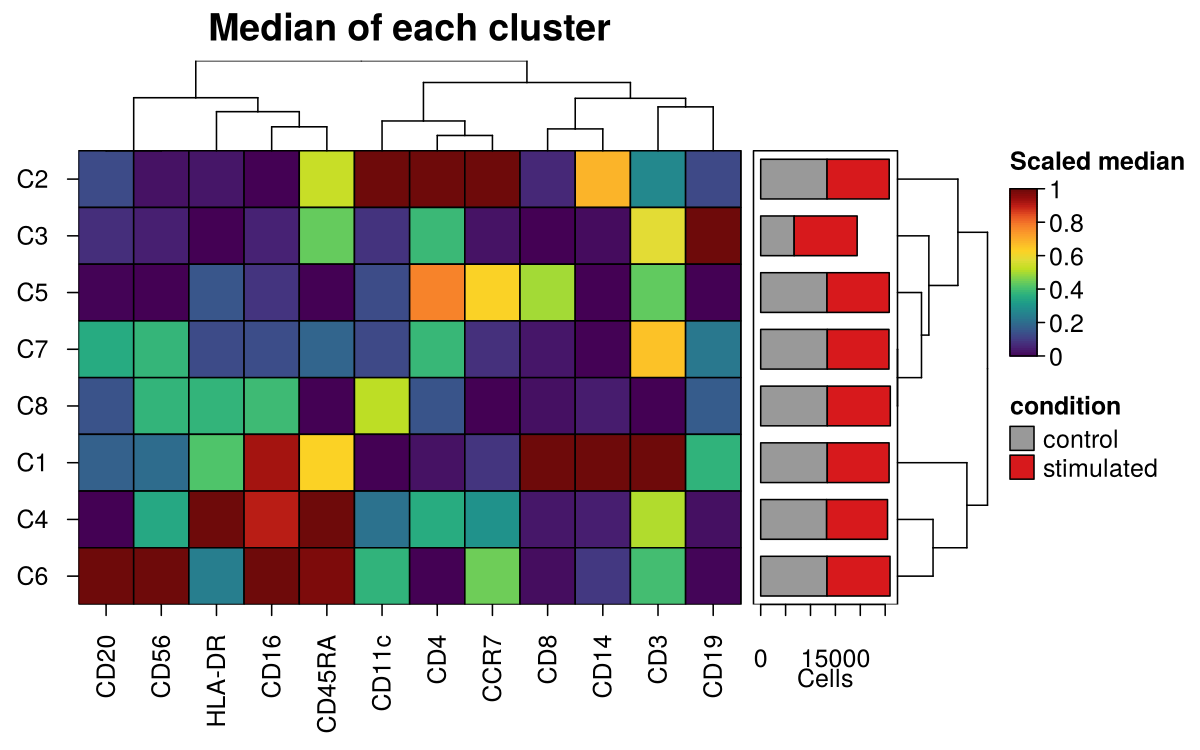 Cytometry clusters |
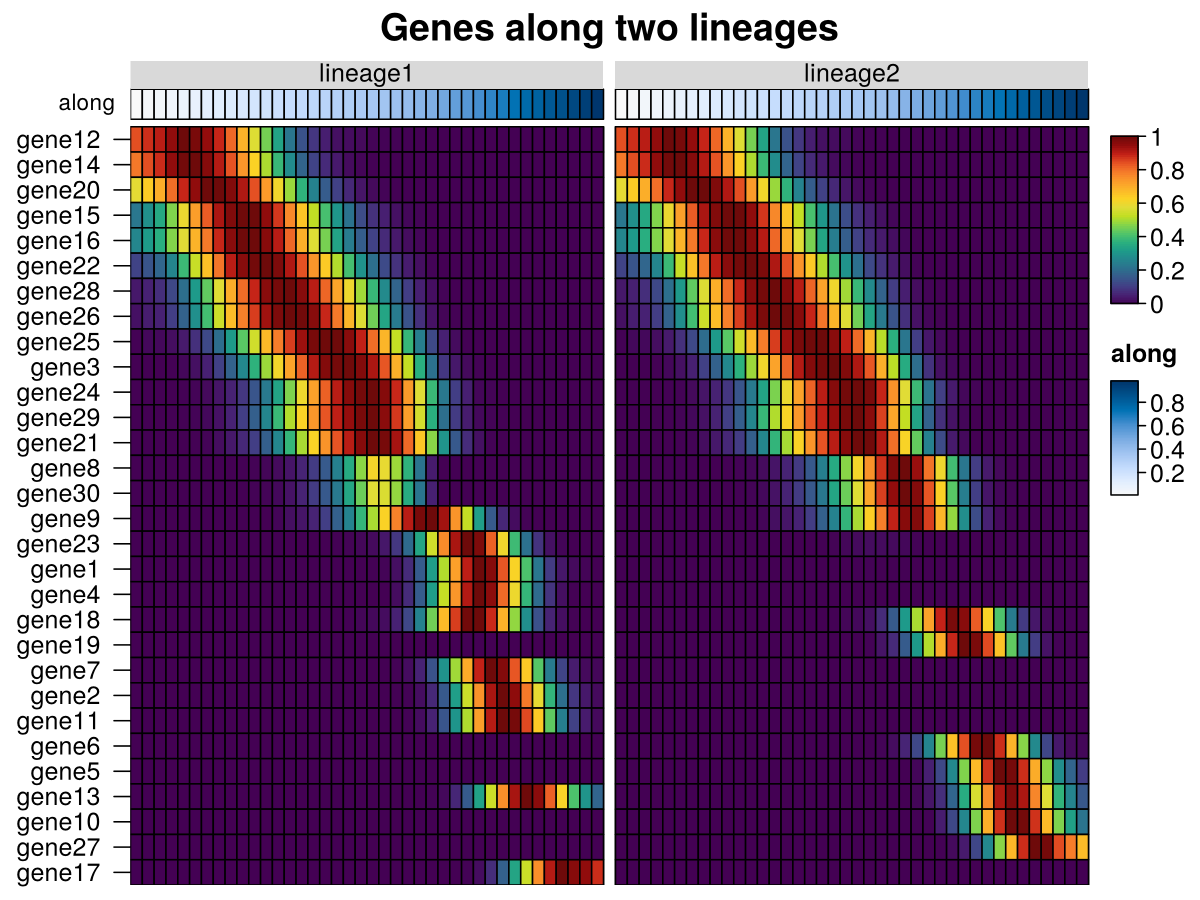 Trajectories |
The guides on the website cover ordering, large heatmaps, single-cell data, cells, and working with other packages, and the changelog lists everything new in HeatmapR 2.0.0.
Installation
HeatmapR can be installed from CRAN:
install.packages("HeatmapR")The development version can be installed directly from GitHub:
devtools::install_github("DillonHammill/HeatmapR")HeatmapR contains C++ code: CRAN provides ready-built binaries for Windows and macOS, but installing from GitHub (or from source) needs a compiler - Rtools on Windows or the Xcode command line tools on macOS.
Usage
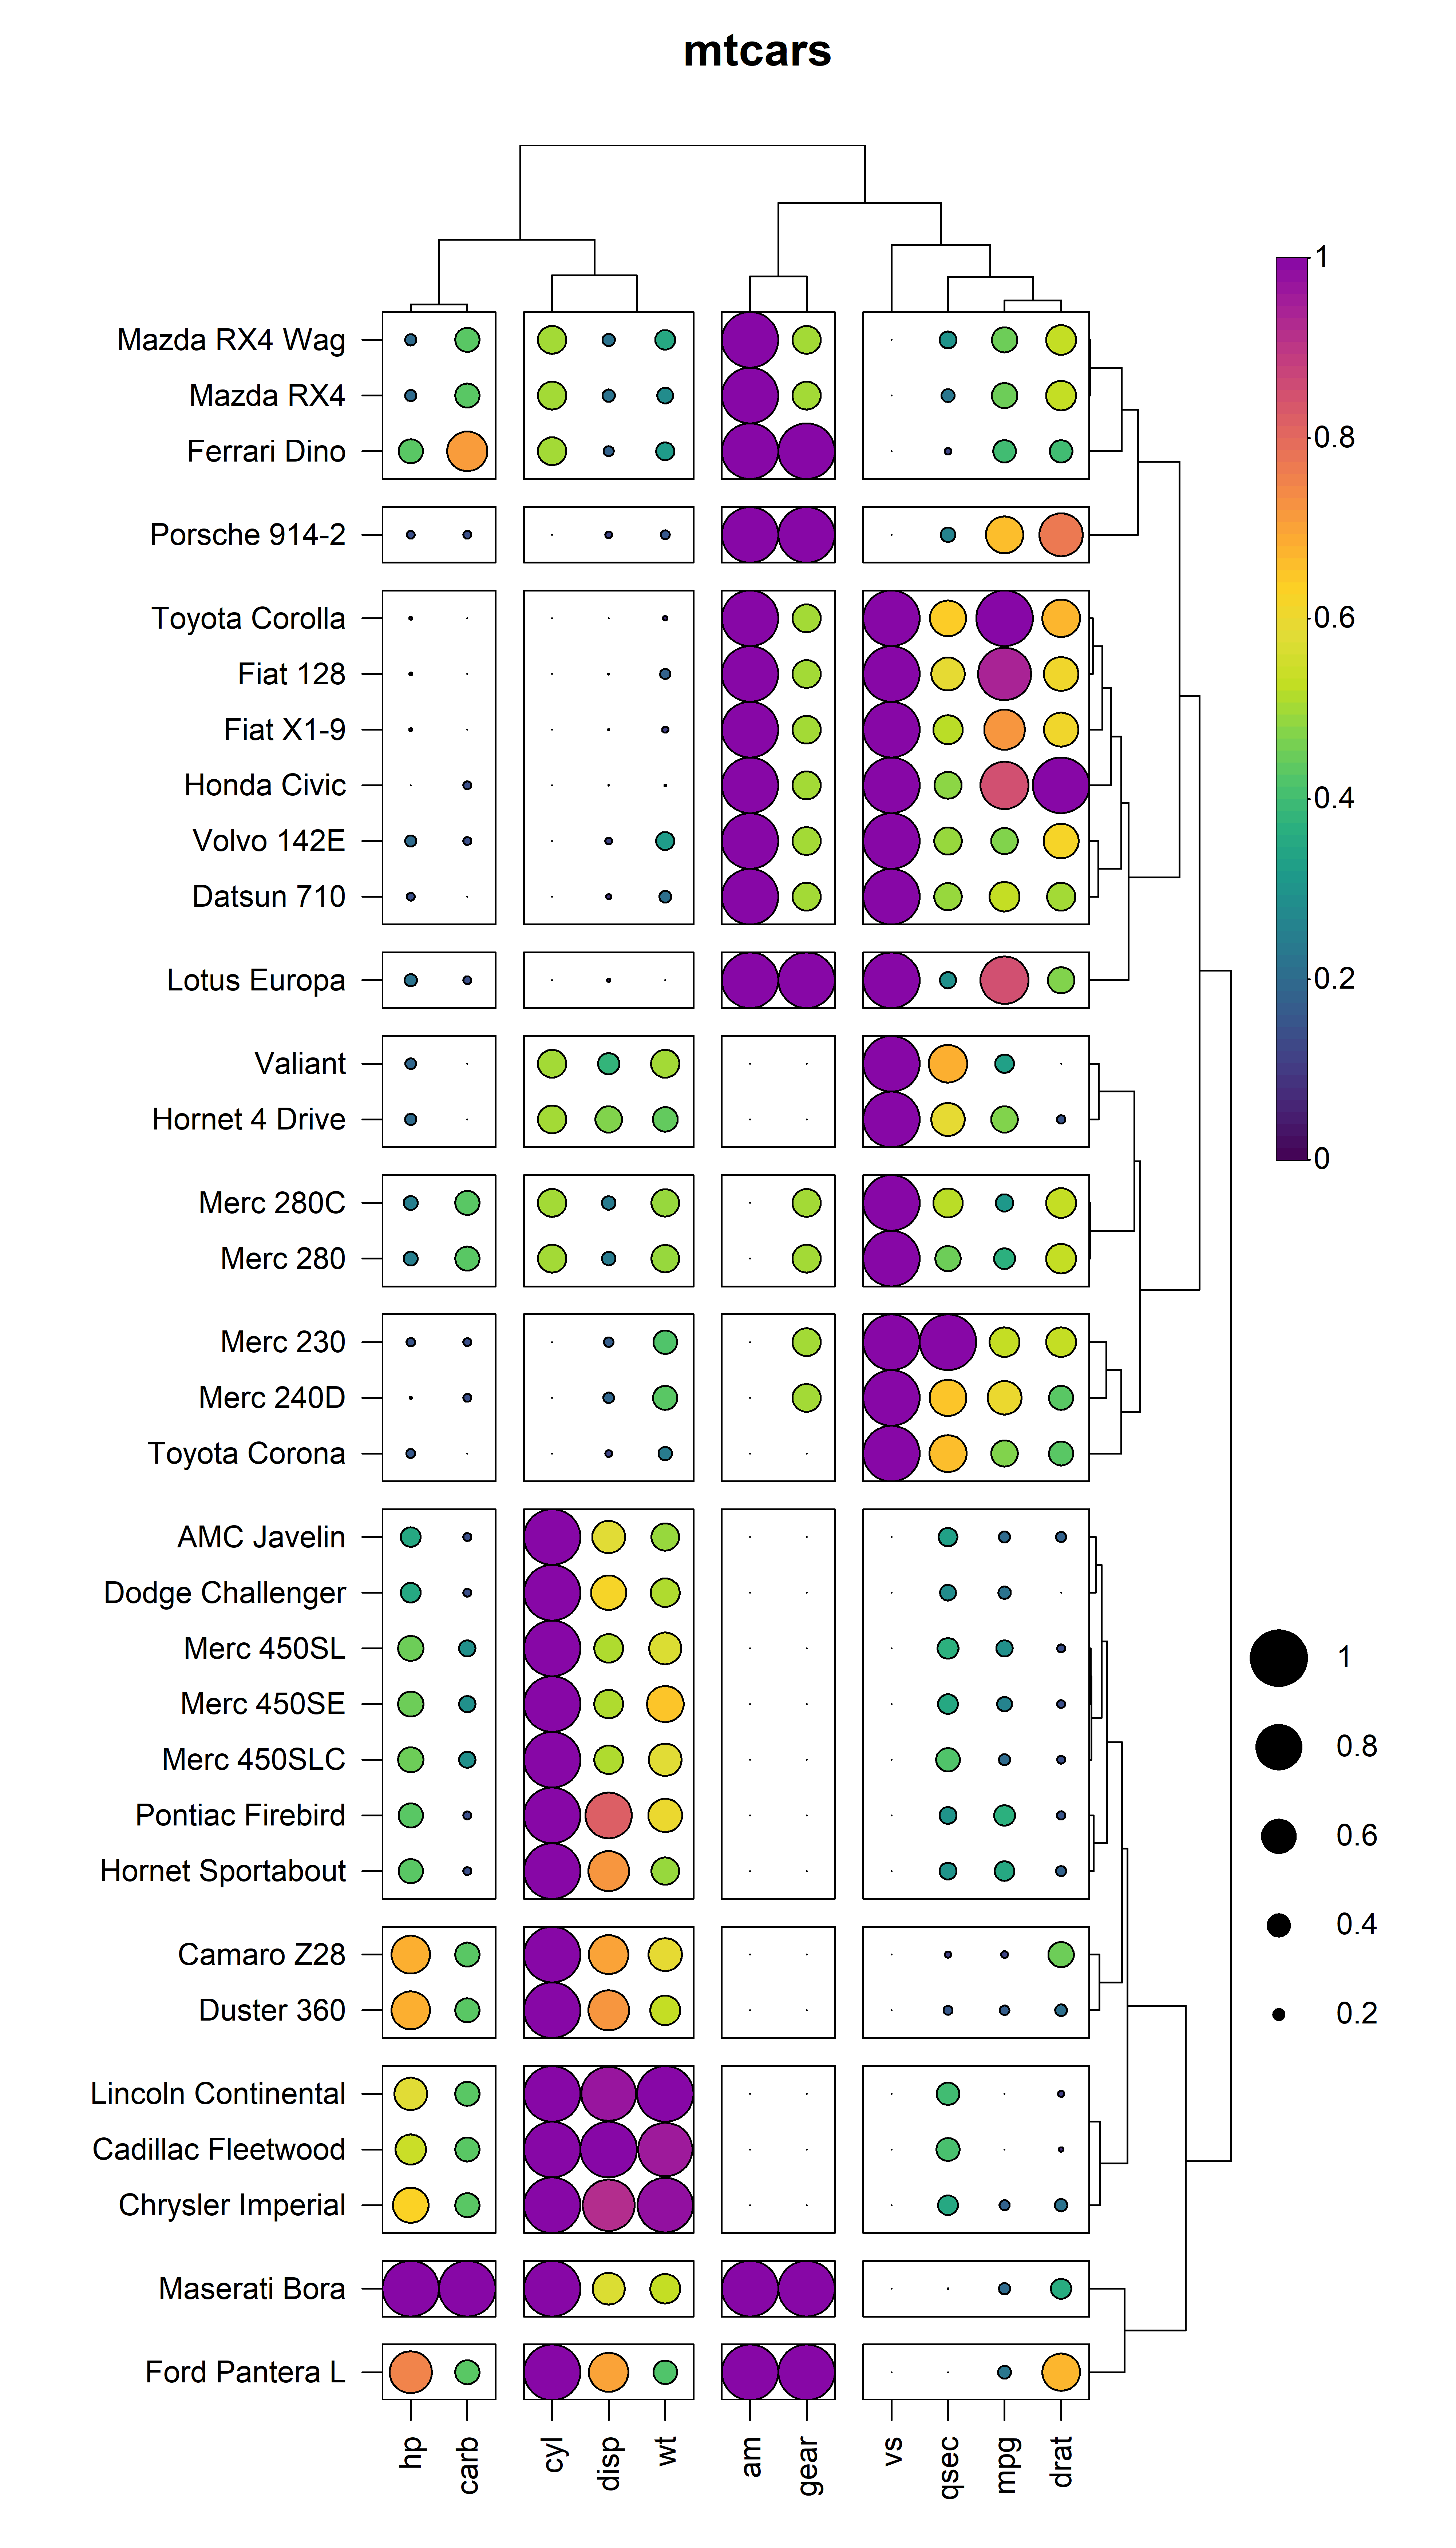
Creating heatmaps is as easy as loading HeatmapR and supplying your dataset to the heat_map() function. For details on customising your heatmaps, refer to the package vignette.
library(HeatmapR)
heat_map(
  mtcars,
  scale = "column",
  scale_method = "range",
  tree_x = TRUE,
  tree_y = TRUE,
  tree_cut_x = 4,
  tree_cut_y = 12,
  cell_size = TRUE,
  cell_shape = "circle",
  title = "mtcars"
)
Acknowledgements
HeatmapR computes distances and hierarchical clustering in compiled code that follows the methods of the stats package (stats::dist() and stats::hclust()), which it still uses for the methods the compiled code doesn’t cover. Dendrograms are drawn by HeatmapR’s own code. Versions up to 1.1.0 drew them with modified functions of the ggdendro package, which were removed in 2.0.0.
Code of Conduct
Please note that the HeatmapR project is released with a Contributor Code of Conduct. By contributing to this project, you agree to abide by its terms.
Citation
If you use HeatmapR for your work please cite the package as follows:
citation("HeatmapR")
#> To cite package 'HeatmapR' in publications use:
#>
#>   Hammill D (2026). _HeatmapR: Create Heatmaps Using Base Graphics_. R
#>   package version 2.0.0, <https://dillonhammill.github.io/HeatmapR/>.
#>
#> A BibTeX entry for LaTeX users is
#>
#>   @Manual{,
#>     title = {HeatmapR: Create Heatmaps Using Base Graphics},
#>     author = {Dillon Hammill},
#>     year = {2026},
#>     note = {R package version 2.0.0},
#>     url = {https://dillonhammill.github.io/HeatmapR/},
#>   }