Convert a heatmap into a grob for grid and ggplot2 layouts
Source:R/heat_map_grob.R
heat_map_grob.Rdheat_map_grob() turns a heatmap into a grid graphical object
(grob), so that it can sit beside ggplot2 plots in patchwork,
cowplot or gridExtra layouts, or be drawn with
grid::grid.draw(). The grob draws the heatmap again whenever its
space changes, so the layout sizes the dendrograms, legends and text
for the space the heatmap is given. The dendrograms are kept in the
heatmap, so drawing it again doesn't cluster it again.
Details
The heatmap is drawn with base graphics and converted to grid by the
gridGraphics package, which must be installed. In patchwork,
wrap_elements(full = ~ plot(hm)) does the same without
heat_map_grob().
See also
heat_map_data to rebuild a heatmap with
ggplot2 from its data.
Examples
if(requireNamespace("gridGraphics", quietly = TRUE)) {
hm <- heat_map(
mtcars,
scale = "column",
tree = "both",
popup = FALSE
)
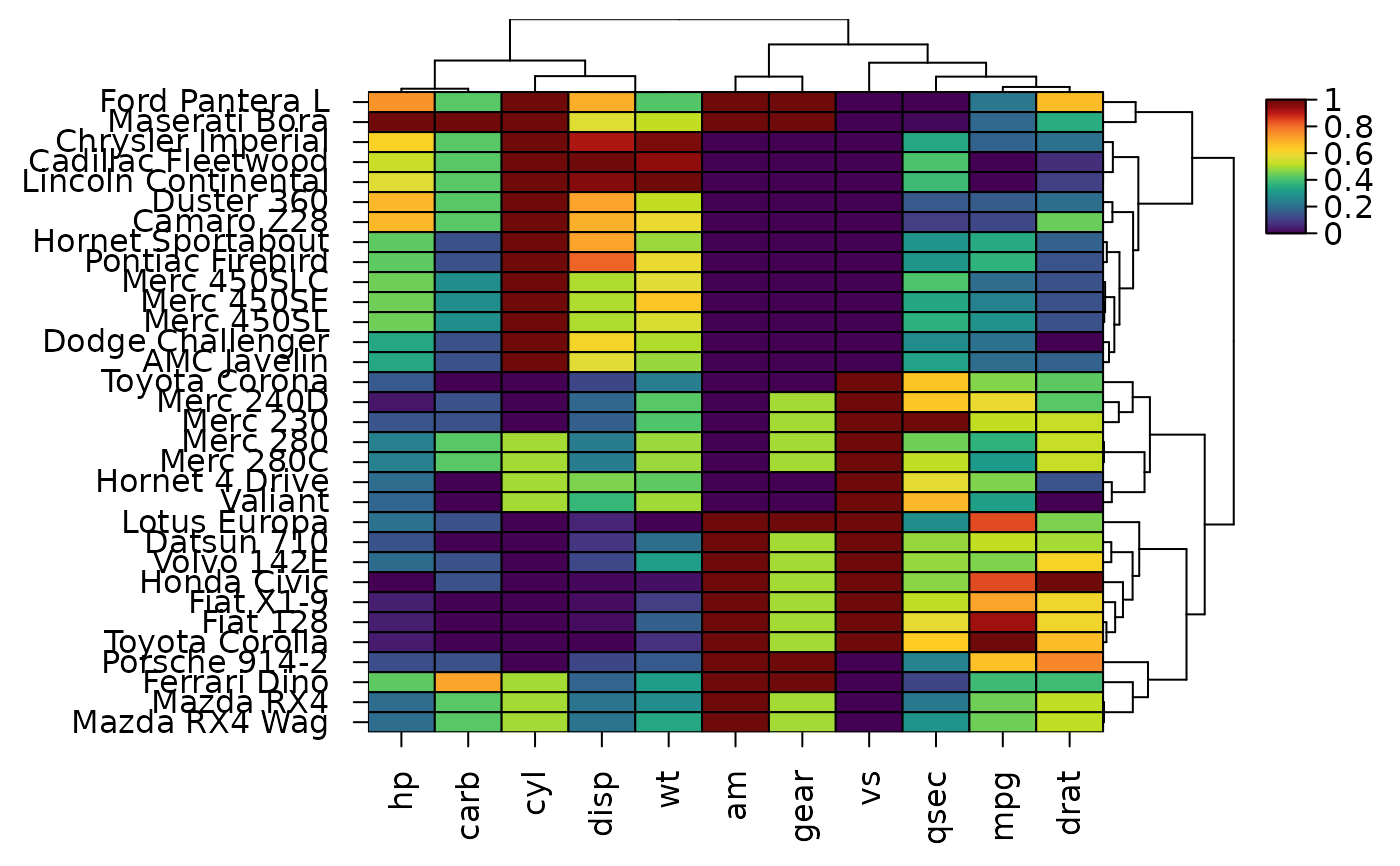
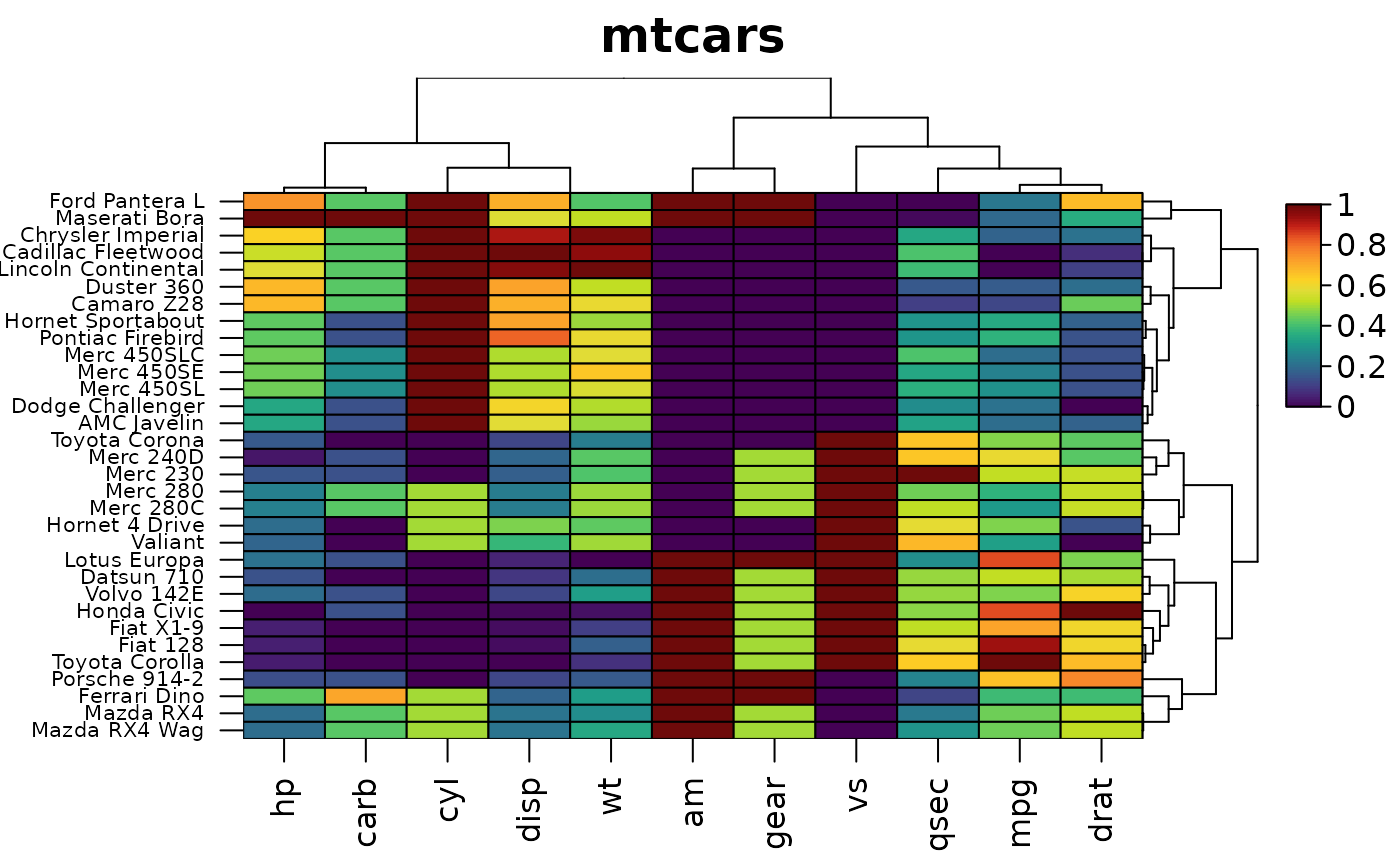
g <- heat_map_grob(hm, title = "mtcars")
grid::grid.newpage()
grid::grid.draw(g)
}
#> Applying range scaling to each column...
 # Beside a ggplot2 plot with patchwork
if(requireNamespace("gridGraphics", quietly = TRUE) &&
requireNamespace("ggplot2", quietly = TRUE) &&
requireNamespace("patchwork", quietly = TRUE)) {
library(ggplot2)
library(patchwork)
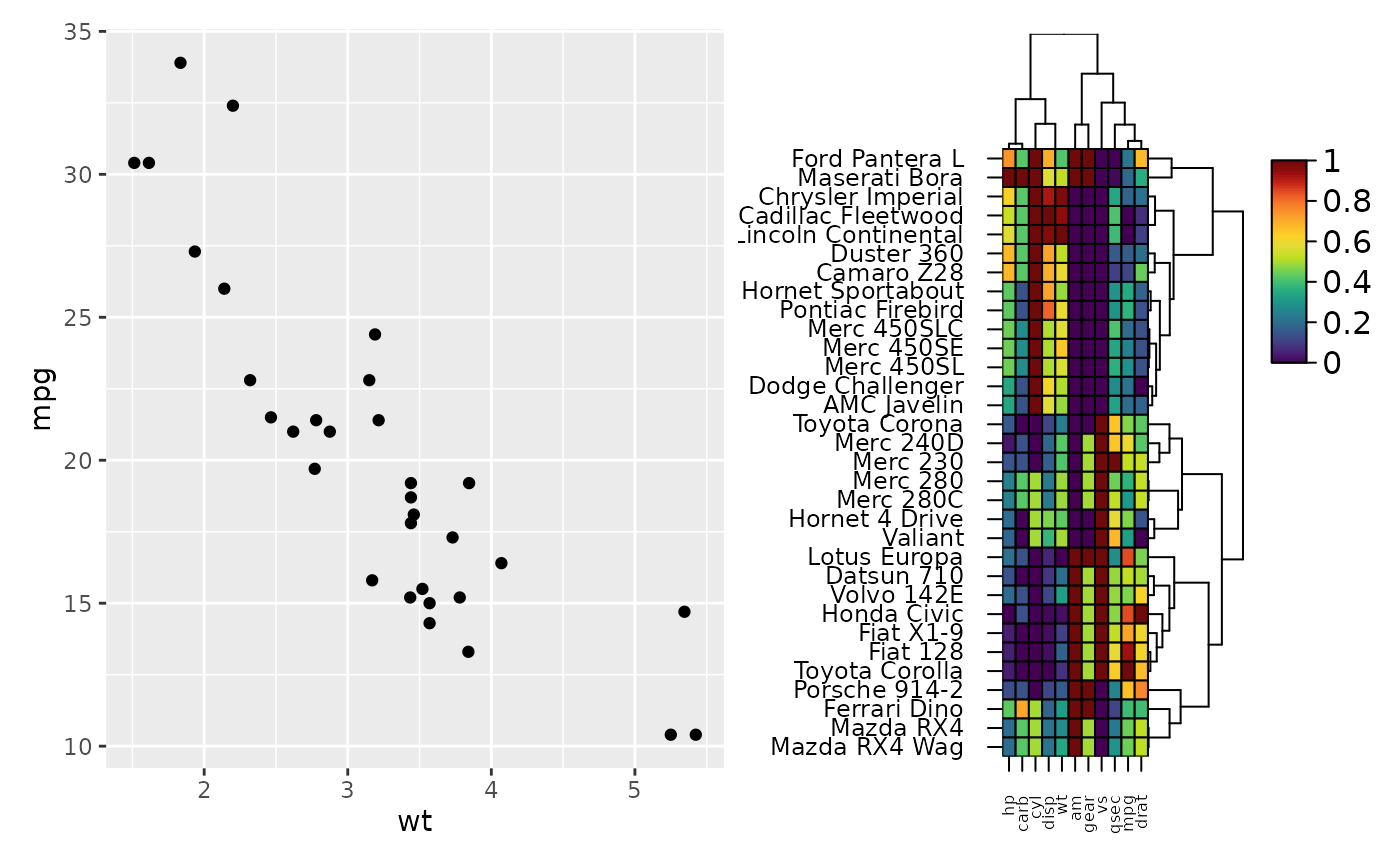
ggplot(mtcars, aes(wt, mpg)) + geom_point() + heat_map_grob(hm)
}