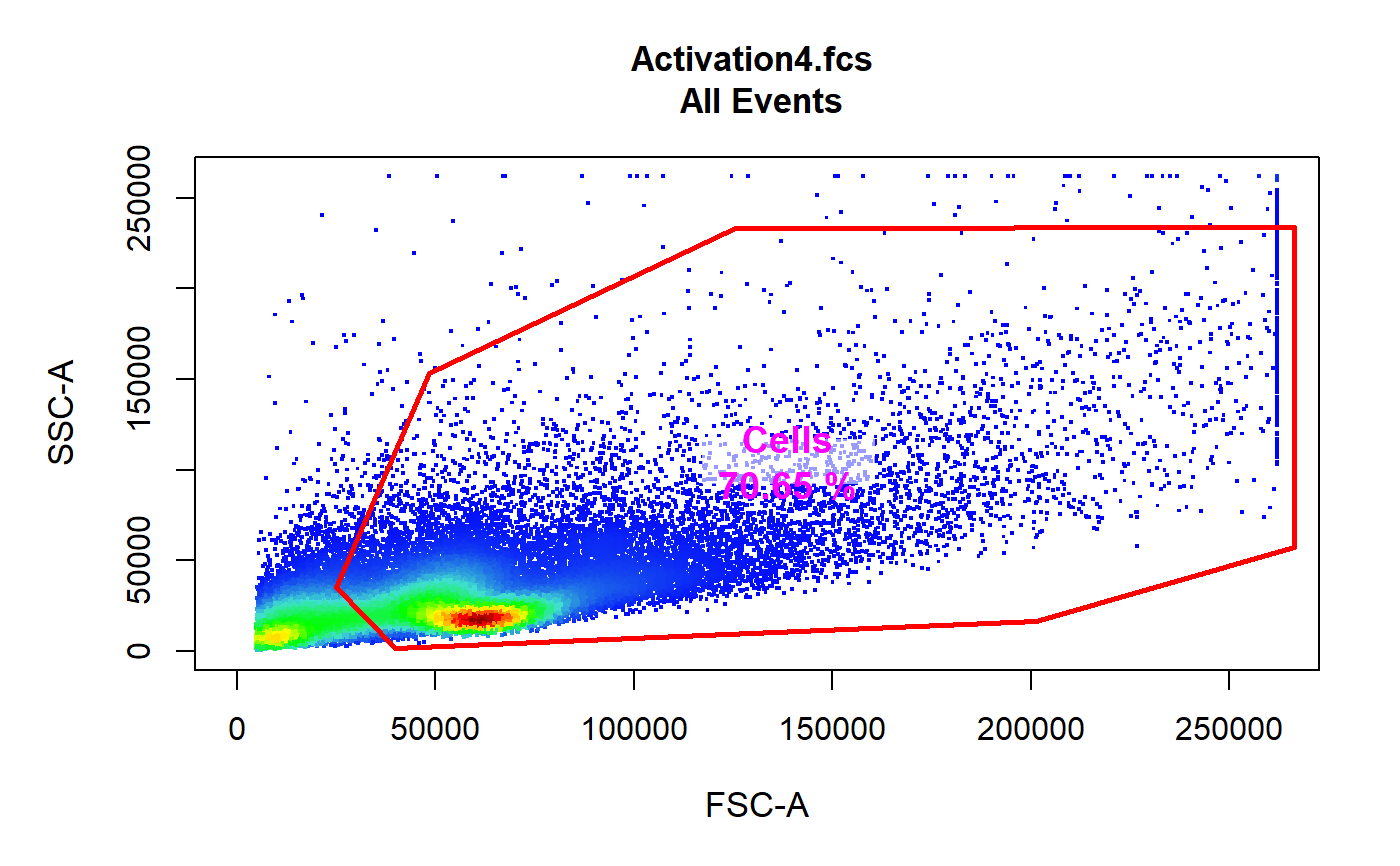
Add boxed text labels to cyto_plot - polygonGate Method
Source:R/cyto_plot_label-methods.R
cyto_plot_label-flowFrame-polygonGate-method.Rdcyto_plot_label takes on a flowFrame object, population name
text, channels and a gate object to construct a text label for
the plot with the population name and frequency.
# S4 method for flowFrame,polygonGate
cyto_plot_label(x, gates, channels,
  trans = NULL, text = NA, stat = NA, text_x = NA, text_y = NA,
  text_font = 2, text_size = 0.8, text_col = "black",
  box_alpha = 0.6)
Arguments
| x | a |
|---|---|
| gates | an object of class
|
| channels | a vector indicating the fluorescent channel(s) to be used for gating. |
| trans | object of class
|
| text | the name of the gated population, set to NA by default to only include percent in labels. |
| stat | indicates the type of statistic to include in the label, can be
either |
| text_x | vector containing the x co-ordinates for the plot labels. Set
to |
| text_y | vector containing the x co-ordinates for the plot labels. Set
to |
| text_font | integer [1,2,3,4] passed to |
| text_size | numeric character expansion used to control the size of the
text in the labels, set to |
| text_col | specify text colour in label for each gate, defaults to
|
| box_alpha | numeric [0,1] controls the transparency of the background,
set to |
Value
add a boxed text label to cyto_plot.
See also
cyto_plot_label,flowFrame,rectangleGate-method
cyto_plot_label,flowFrame,ellipsoidGate-method
Examples
#>#>#>#>#># Apply compensation gs <- compensate(gs, fs[[1]]@description$SPILL) # Transform fluorescent channels trans <- estimateLogicle(gs[[4]], cyto_fluor_channels(fs)) gs <- transform(gs, trans) # Gate using gate_draw gating(Activation_gatingTemplate, gs)#>#>#>#>#>#>#>#>#>#>#>#>#>#>#>#>#>#>#>#>#>#>#>#>#>#>#>#># Labels cyto_plot_label(getData(gs, "root")[[4]], gates = gt, trans = trans, channels = c("FSC-A", "SSC-A"), text = "Cells", stat = "freq", text_col = "magenta", text_size = 1.2 )
