cyto_plot - GatingHierarchy Method
Source:R/cyto_plot-methods.R
cyto_plot-GatingHierarchy-method.RdExplore & visualise a GatingHierarchy.
# S4 method for GatingHierarchy
cyto_plot(x, parent, alias = NULL, channels,
  axes_trans = NULL, overlay = NULL, gate = NA, limits = "machine",
  popup = FALSE, xlim = NULL, ylim = NULL, title, xlab = NA,
  ylab = NA, density_modal = TRUE, density_smooth = 1.5,
  density_stack = 0, density_fill = NA, density_fill_alpha = 1,
  density_line_type = 1, density_line_width = 1,
  density_line_col = "black", point_shape = ".", point_size = 2,
  point_col = NA, point_alpha = 1, contour_lines = 0,
  contour_line_type = 1, contour_line_width = 1,
  contour_line_col = "black", axes_text_font = 1, axes_text_size = 1,
  axes_text_col = "black", axes_label_text_font = 1,
  axes_label_text_size = 1.1, axes_label_text_col = "black",
  title_text_font = 2, title_text_size = 1.1,
  title_text_col = "black", legend = FALSE, legend_text,
  legend_text_font = 1, legend_text_size = 1,
  legend_text_col = "black", legend_line_col = NA,
  legend_box_fill = NA, legend_point_col = NA, gate_line_type = 1,
  gate_line_width = 2.5, gate_line_col = "red", label = TRUE,
  label_text = NA, label_stat = "percent", label_text_font = 2,
  label_text_size = 1, label_text_col = "black", label_box_x = NA,
  label_box_y = NA, label_box_alpha = 0.6, border_line_type = 1,
  border_line_width = 1, border_line_col = "black", ...)
Arguments
| x | object of class
|
|---|---|
| parent | name of the population to plot. |
| alias | name of the gated population for which the gate should be drawn on the plot. |
| channels | name of the channel(s) or marker(s) to be used to construct the plot. The length of channels determines the type of plot to be constructed, either a 1-D density distribution for a single channel or a 2-D scatterplot with blue-red colour scale for two channels. |
| axes_trans | object of class
|
| overlay | name(s) of the populations to overlay or a |
| gate | gate object(s) to be added to plot. For |
| limits | indicates whether the axes limits should be based on the
|
| popup | logical indicating whether the plot should be constructed in a
pop-up window, set to FALSE by default. |
| xlim | lower and upper limits of x axis (e.g. c(0,5)). |
| ylim | lower and upper limits of y axis (e.g. c(0,5)). |
| title | title to use for the plot, set to the name of the sample by
default. Title can be removed by setting this argument to |
| xlab | x axis label. |
| ylab | y axis label. |
| density_modal | logical indicating whether density should be normalised
to mode and presented as a percentage for 1-D plots. Set to |
| density_smooth | smoothing parameter passed to
|
| density_stack | numeric [0,1] indicating the degree of offset for 1-D density distributions with overlay, set to 0.5 by default. |
| density_fill | fill colour(s) for 1-D density distributions. |
| density_fill_alpha | numeric [0,1] used to control 1-D density fill colour transparency, set to 1 by default for solid colours. |
| density_line_type | line type(s) to use for 1-D density lines, set to 1
by default to use solid lines. See |
| density_line_width | numeric to control line width(s) for 1-D density lines, set to 1 by default. |
| density_line_col | colour(s) for 1-D density lines, set to
|
| point_shape | shape(s) to use for points in 2-D scatterplots, set to
|
| point_size | numeric to control the size of points in 2-D scatter plots set to 2 by default. |
| point_col | colour(s) to use for points in 2-D scatter plots, set to NA by default to use a blue-red density colour scale. |
| point_alpha | numeric [0,1] to control point colour transparency in 2-D scatter plots, set to 1 by default to use solid colours. |
| contour_lines | numeric indicating the number of levels to use for contour lines in 2-D scatter plots, set to 0 by default to turn off contour lines. |
| contour_line_type | integer [0,6] to control the line type of contour
lines in 2-D scatter plots, set to |
| contour_line_width | numeric to control line width(s) for contour lines in 2-D scatter plots, set to 2 by default. |
| contour_line_col | colour(s) to use for contour lines in 2-D scatter
plots, set to |
| axes_text_font | numeric to control the font of axes text, set to 1 for
plain font by default. See |
| axes_text_size | numeric to control the size of axes text, set to 1 by default. |
| axes_text_col | colour to use for axes text, set to |
| axes_label_text_font | numeric to control the font axes labels, set to 1
for plain font by default. See |
| axes_label_text_size | numeric to control the text size of axes labels, set to 1.1 by default. |
| axes_label_text_col | colour to use for axes labels text, set to
|
| title_text_font | numeric to control the font of title text, set to 2
for bold font by default. See |
| title_text_size | numeric to control the text size of the plot title, set to 1.1 by default. |
| title_text_col | colour to use for plot title text, set to
|
| legend | can be either |
| legend_text | vector of labels to use in the legend. |
| legend_text_font | numeric to control the font of legend text, set to 1
for plain font by default. See |
| legend_text_size | numeric to control the size of text in the legend, set to 1 by default. |
| legend_text_col | colour(s) to use for text in legend, set to
|
| legend_line_col | colour(s) to use for the lines in 1-D plot legends
when legend is set to |
| legend_box_fill | fill colour(s) to use for the boxes in 1-D plot
legends when legend is set to |
| legend_point_col | colour(s) to use for points in 2-D scatter plot legend. |
| gate_line_type | integer [0,6] to control the line type of gates, set to
|
| gate_line_width | numeric to control the line width(s) of gates, set to
|
| gate_line_col | colour(s) to use for gates, set to |
| label | logical indicating whether gated populations should be labelled.
To include the names of the populations in these labels, supply the
population names to the |
| label_text | vector of population names to use in the labels. Set to
|
| label_stat | indicates the type of statistic to include in the plot
labels, can be |
| label_text_font | numeric to control the font of text in plot labels,
set to 2 for bold font by default. See |
| label_text_size | numeric to control the size of text in the plot labels, set to 1 by default. |
| label_text_col | colour(s) to use for text in plot labels, set to
|
| label_box_x | vector of x co-ordinate(s) to manually adjust the position plot label(s) on the plot. |
| label_box_y | vector of y co-ordinate(s) to manually adjust the position plot label(s) on the plot. |
| label_box_alpha | numeric to control background fill transparency of label boxes, set to 0.6 by default to introduce some transparency. |
| border_line_type | integer [0,6] to control the line type of plot
border, set to |
| border_line_width | numeric to control line width for the plot border, set to 1 by default. |
| border_line_col | colour to use for the plot border, set to "black" by default. |
| ... | additional arguments passed to |
See also
Examples
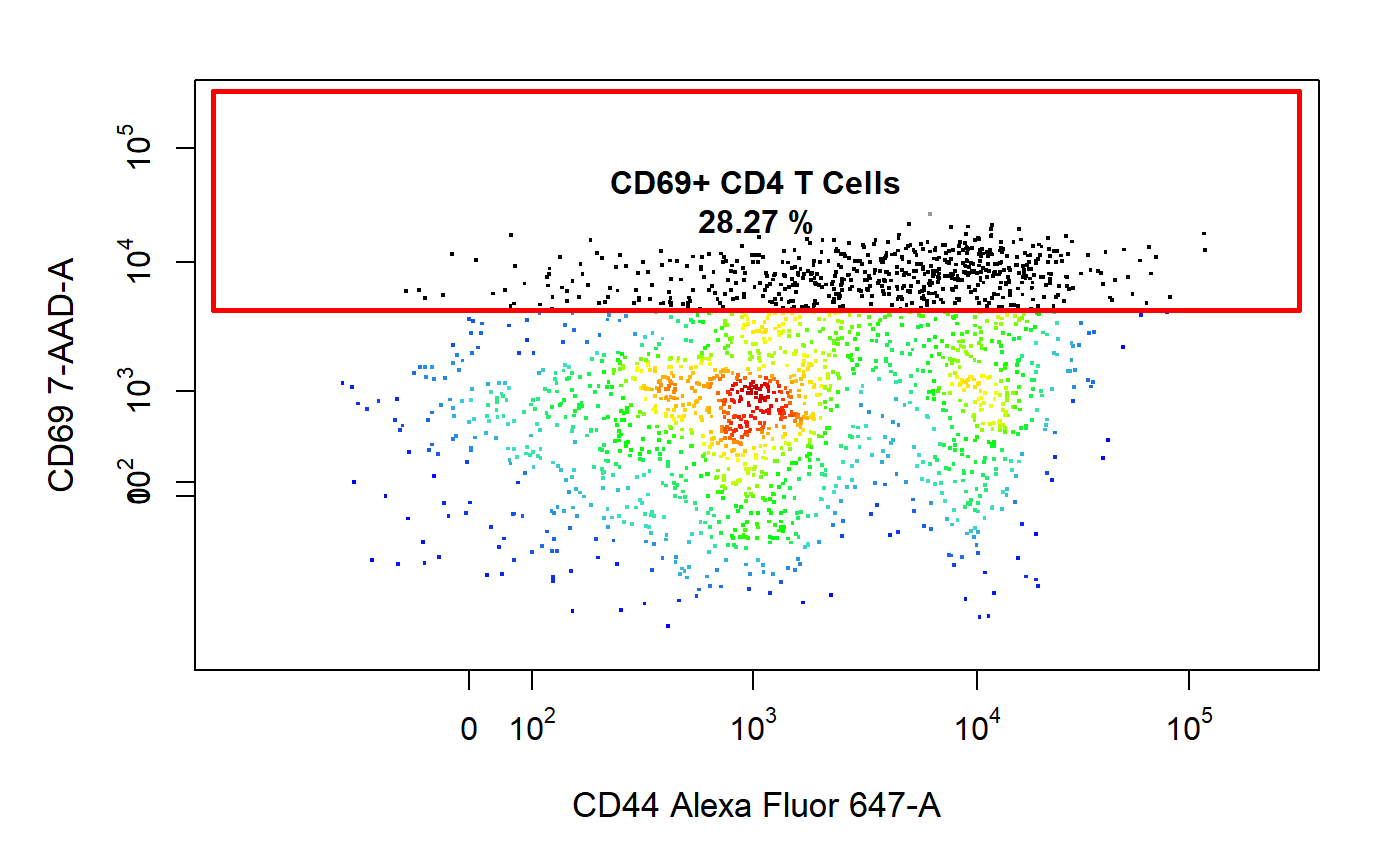
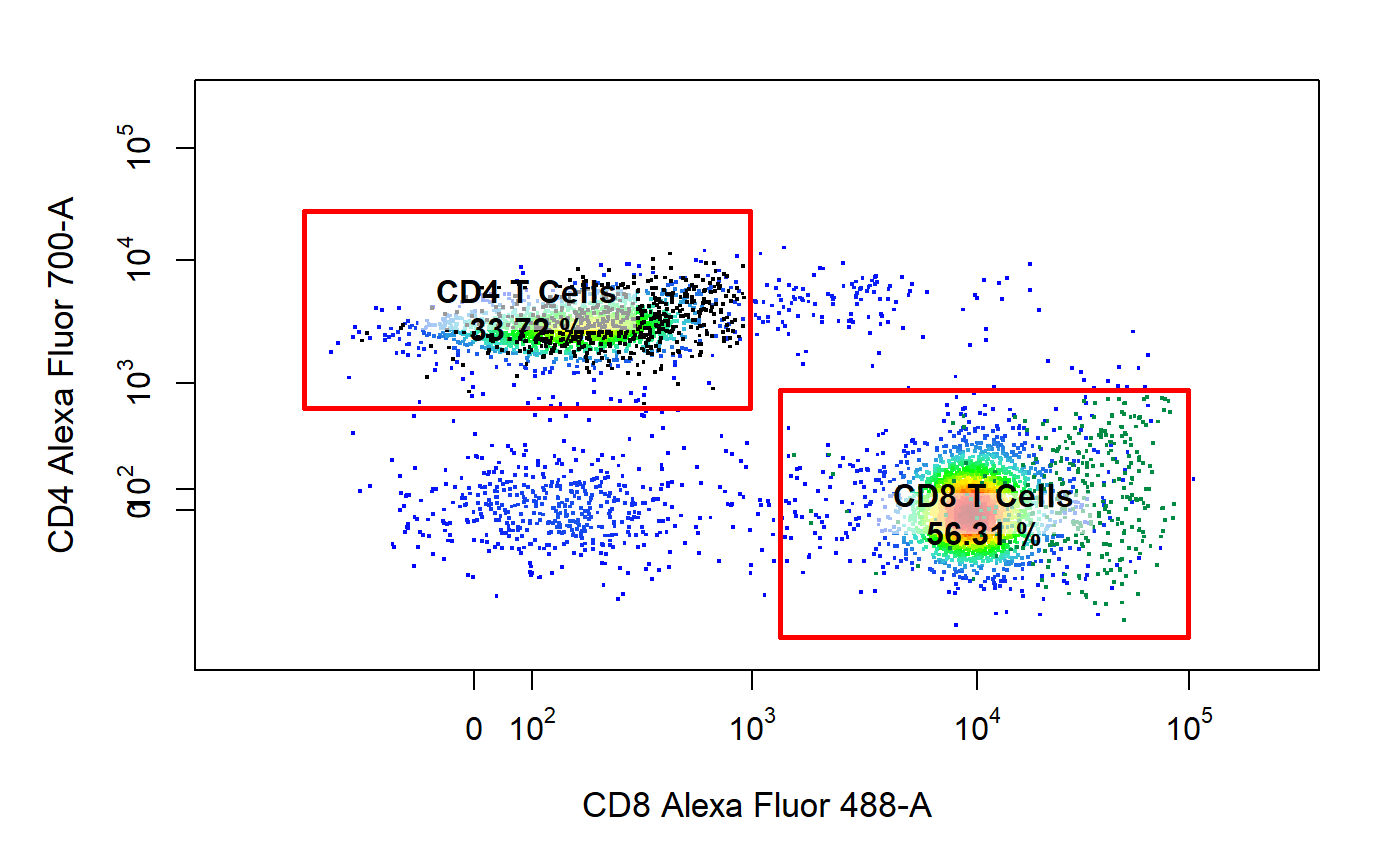
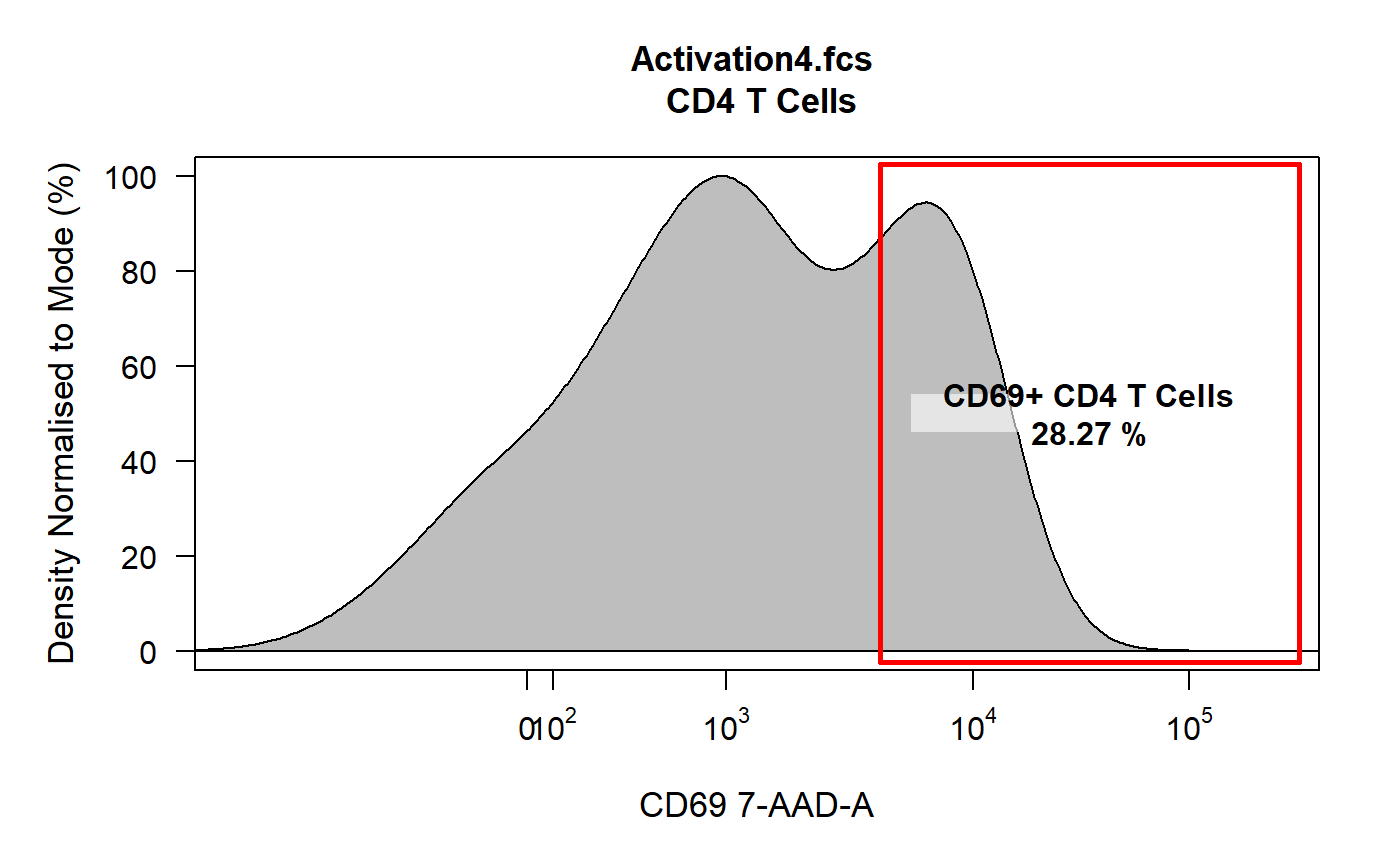
#>#>#>#>#># Apply coompensation gs <- compensate(gs, fs[[1]]@description$SPILL) # Transform fluorescent channels trans <- estimateLogicle(gs[[4]], cyto_fluor_channels(gs)) gs <- transform(gs, trans) # Apply gatingTemplate gt <- Activation_gatingTemplate gating(gt, gs)#>#>#>#>#>#>#>#>#>#>#>#>#>#>#>#>#>#>#>#>#>#>#>#>#>#>#>#>#># 2-D scatter plot with Overlays & Gate cyto_plot(gs[[4]], parent = "CD4 T Cells", alias = "CD69+ CD4 T Cells", channels = c("Alexa Fluor 647-A", "7-AAD-A"), overlay = "CD69+ CD4 T Cells", )# 2-D Scatter plot with Back-Gating & Gates cyto_plot(gs[[4]], parent = "T Cells", alias = c("CD4 T Cells", "CD8 T Cells"), channels = c("Alexa Fluor 488-A", "Alexa Fluor 700-A"), overlay = c("CD69+ CD4 T Cells", "CD69+ CD8 T Cells") )# 1-D density distribution cyto_plot(gs[[4]], parent = "CD4 T Cells", alias = "CD69+ CD4 T Cells", channels = "7-AAD-A" )