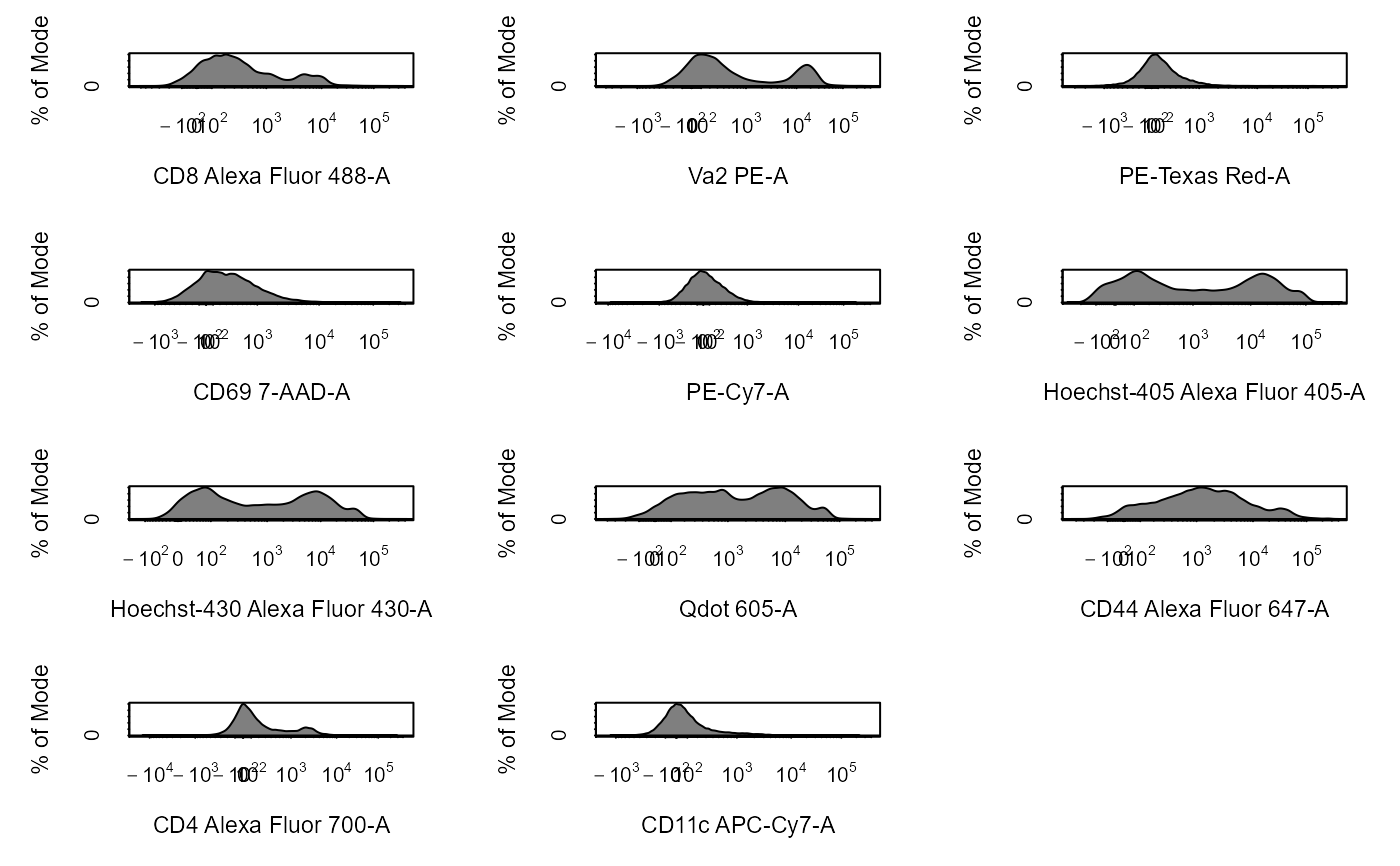
Plot expression profile in all channels
# S3 method for GatingSet
cyto_plot_profile(
  x,
  parent = NULL,
  channels = NULL,
  group_by = NA,
  select = NULL,
  axes_trans = NA,
  layout = NULL,
  header = NULL,
  header_text_font = 2,
  header_text_size = 1,
  ...
)

# S3 method for GatingHierarchy
cyto_plot_profile(
  x,
  parent = NULL,
  channels = NULL,
  axes_trans = NA,
  header = NULL,
  header_text_font = 2,
  header_text_size = 1,
  ...
)

# S3 method for flowSet
cyto_plot_profile(
  x,
  channels = NULL,
  group_by = NA,
  select = NA,
  axes_trans = NULL,
  layout = NULL,
  header = NULL,
  header_text_font = 2,
  header_text_size = 1,
  density_stack = 0.5,
  ...
)

# S3 method for flowFrame
cyto_plot_profile(
  x,
  channels = NULL,
  axes_trans = NA,
  layout = NULL,
  header = NULL,
  header_text_font = 2,
  header_text_size = 1,
  ...
)
Arguments
| x | object of class |
|---|---|
| parent | name of the population to plot when a |
| channels | a vector channels to use to construct the plots, set to all channels by default. |
| group_by | a vector of experiment variables to sort and merge samples
into groups prior to plotting, set to NA by default to prevent merging.
To merge all samples set this argument to |
| select | designates which samples will be plotted and used for
determining the best location to set the drawn gate(s). Filtering steps
should be comma separated and wrapped in a list. Refer to
|
| axes_trans | object of class
|
| layout | a vector of the length 2 indicating the dimensions of the grid
for plotting |
| header | character string to include in the plot header, set to the sample names by deafult. The header can be removed by setting this argument to NA. |
| header_text_font | numeric indicating the font to use for the header, set to 2 by default for bold font. |
| header_text_size | numeric to control the text size of the header, set to 1 by deafult. |
| ... | additional arguments passed to |
| density_stack | numeric [0,1] indicating the degree of offset for 1-D density distributions with overlay, set to 0.5 by default. |
See also
Author
Dillon Hammill (Dillon.Hammill@anu.edu.au)
Examples
# Load in CytoExploreR to access data library(CytoExploreRData) # Load in samples fs <- Activation gs <- GatingSet(fs) # Apply compensation gs <- cyto_compensate(gs, fs[[1]]@description$SPILL) # Transform fluorescent channels gs <- cyto_transform(gs, trans_type = "logicle")# Apply gates gt <- Activation_gatingTemplate gt_gating(gt, gs)#>#>#>#>#>#>#>#>#>#>#>#>#>#>#>#>#>#>#>#>#>#>#>#>#>#>#>#>#>#>#>#>#>#>#>#>#>#>#>#># Plot expression profile of T Cells in all channels cyto_plot_profile(gs[1:9], parent = "T Cells" )# Group samples by Treatment & select highest OVAConc cyto_plot_profile(gs[1:9], parent = "CD4 T Cells", group_by = "Treatment", select = list("OVAConc" = 500), )