cyto_plot_layout() sets the panel layout dimensions for combining
different types of cyto_plot plots. Make a call to cyto_plot_layout()
prior to making multiple calls to cyto_plot().
cyto_plot_layout(layout = NULL)
Arguments
| layout | either a vector of the form c(nrow, ncol) defining the
dimensions of the plot or a matrix defining a more sophisticated layout
(see |
|---|
Author
Dillon Hammill (Dillon.Hammill@anu.edu.au)
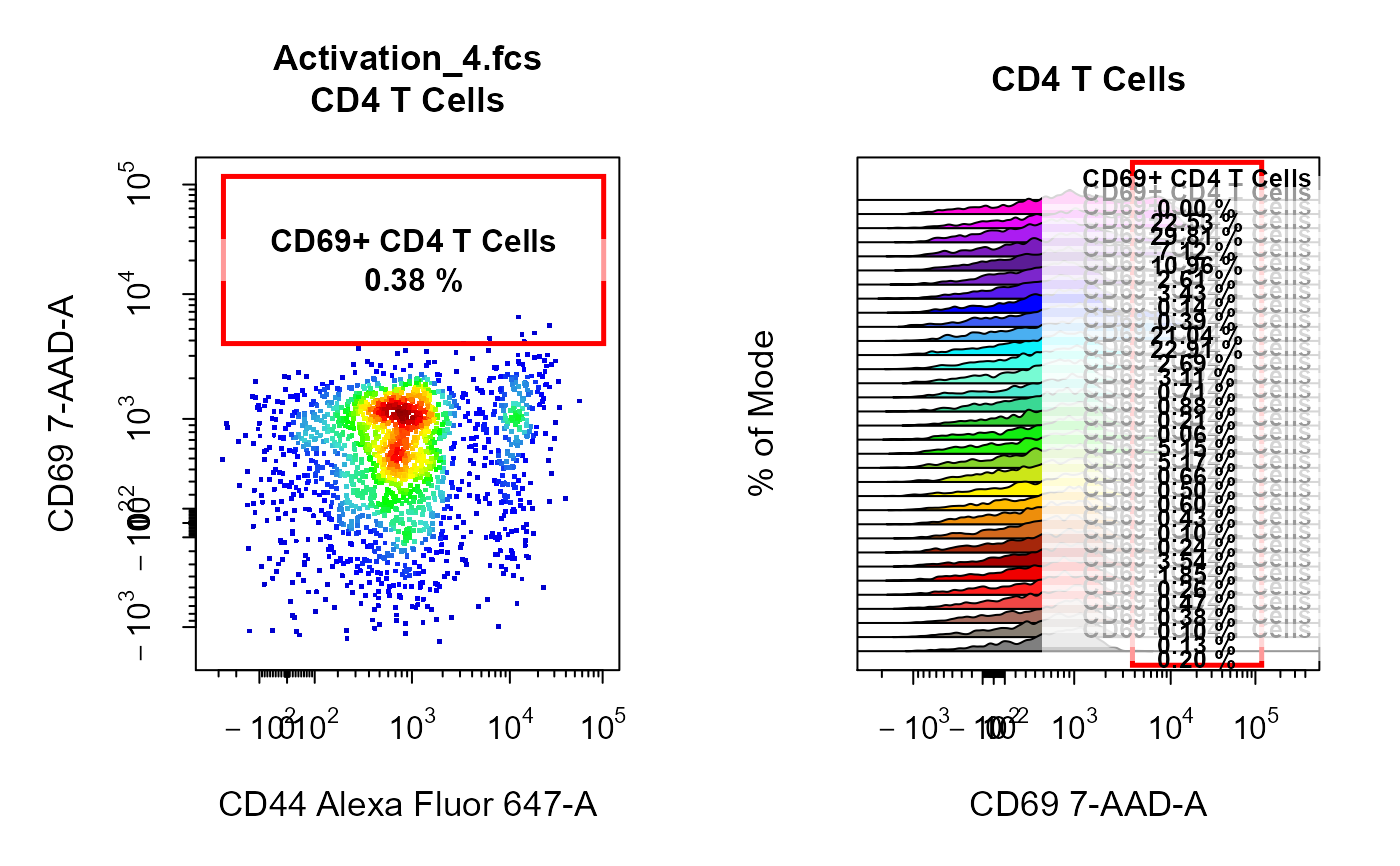
Examples
library(CytoExploreRData) # Load samples into GatingSet fs <- Activation gs <- GatingSet(fs) # Apply compensation gs <- compensate(gs, fs[[1]]@description$SPILL) # Transform fluorescent channels trans <- estimateLogicle(gs[[4]], cyto_fluor_channels(gs)) gs <- transform(gs, trans) # Apply gatingTemplate gt <- Activation_gatingTemplate gt_gating(gt, gs)#>#>#>#>#>#>#>#>#>#>#>#>#>#>#>#>#>#>#>#>#>#>#>#>#>#>#>#>#>#>#>#>#>#>#>#>#>#>#>#># Set out plot layout cyto_plot_layout(c(1,2)) # Add 2D plot cyto_plot(gs[[4]], parent = "CD4 T Cells", alias = "", channels = c("Alexa Fluor 647-A", "7-AAD-A"), layout = FALSE ) # Add 1D plot cyto_plot(gs, parent = "CD4 T Cells", alias = "", channels = "7-AAD-A", density_stack = 0.6, layout = FALSE )