Plot Flow Cytometry Gating Strategies - GatingSet Method
Source:R/cyto_plot_gating_scheme-methods.R
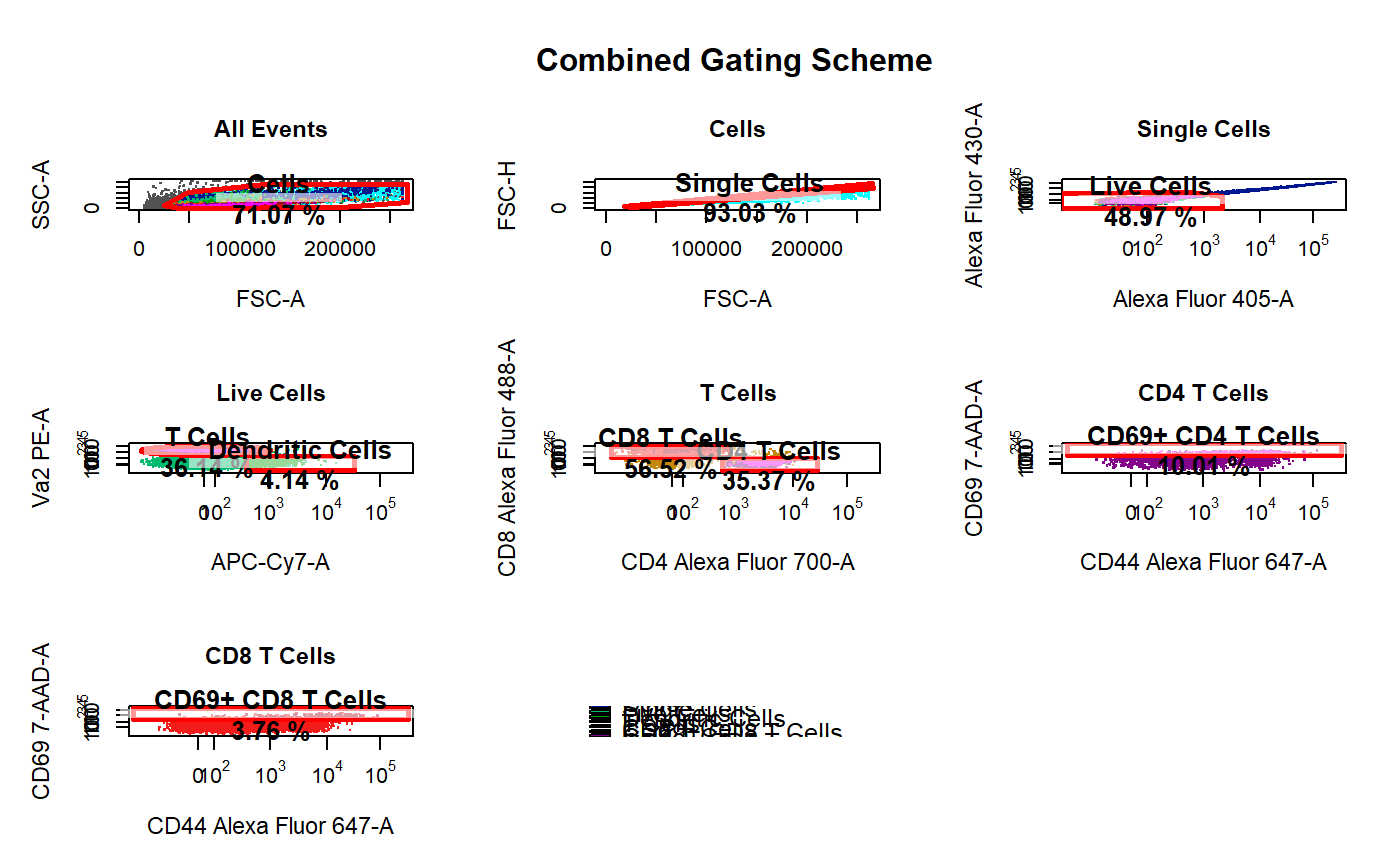
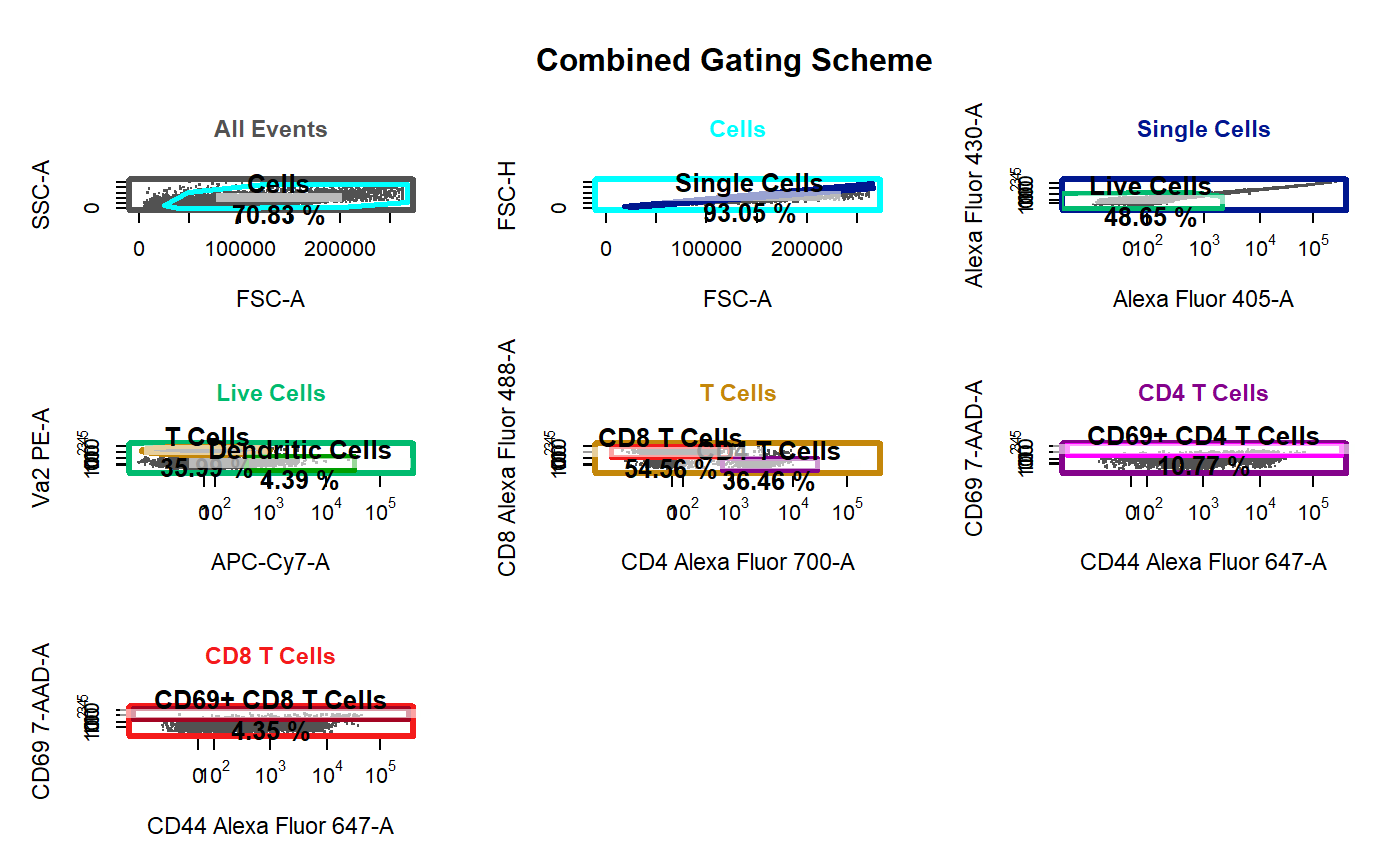
cyto_plot_gating_scheme-GatingSet-method.Rdcyto_plot_gating_scheme automatically plots the entire gating scheme
and has full support for gate tracking and back-gating through
gate_track and back_gate.
# S4 method for GatingSet
cyto_plot_gating_scheme(x, gatingTemplate = NULL,
  group_by, back_gate = FALSE, gate_track = FALSE, show_all = FALSE,
  display = NULL, header = NA, title = NULL, popup = FALSE,
  layout = NULL, point_col = NULL, density_stack = 0.5,
  density_fill = NULL, gate_line_col = NULL, border_line_col = NULL,
  border_line_width = NULL, legend = TRUE, legend_text = NULL,
  legend_text_size = 1.2, title_text_col = NULL,
  label_text_size = 0.8, ...)
Arguments
| x | object of class
|
|---|---|
| gatingTemplate | name of the gatingTemplate csv file used to gate
|
| group_by | a vector of pData variables to merge samples into groups
prior to plotting, set to NULL by default to prevent merging. To merge all
samples set this argument to |
| back_gate | names of the population(s) to back-gate, set to |
| gate_track | logical indicating whether gate colour should be tracked throughout gating scheme, set to TRUE by default. |
| show_all | logical indicating whether every population should be
included in every plot in the gating scheme, set to |
| display | numeric [0,1] to control the percentage of events to be
plotted. Specifying a value for |
| header | character string to use as the header for the plot layout, set to "Gating Scheme" by default. |
| title | vector of titles to use above each plot. |
| popup | logical indicating whether the gating scheme should be plotted in a pop-up window, set to FALSE by default. |
| layout | a vector of the length 2 indicating the dimensions of the grid
for plotting |
| point_col | colour of points in 2D plots set to NA to use default red-blue colour scale. Control the colour of overlays by supplying multiple colours to this argument (e.g. c("blue","red")). |
| density_stack | numeric [0,1] indicating the degree of offset for 1-D density distributions with overlay, set to 0.5 by default. |
| density_fill | fill colour for 1D density distributions. Control the colour of overlays by supplying multiple colours to this argument (e.g. c(NA,"red")). |
| gate_line_col | vector of colours to use for gates. Individual gate
colours can only be controlled when |
| border_line_col | line colour for plot border, set to "black" by default. |
| border_line_width | line width for plot border, set to 3 when gate_track is TRUE. |
| legend | logical indicating whether a legend should be included when an overlay is supplied. |
| legend_text | vector of character strings to use for legend when an overlay is supplied. |
| legend_text_size | character expansion for legend text, set to 1.2 by default. |
| title_text_col | colour for plot title. |
| label_text_size | numeric to control the size of text in the plot labels, set to 0.8 by default. |
| ... | extra arguments passed to cyto_plot, see
|
See also
Examples
#>#>#>#>#># Apply compensation gs <- compensate(gs, fs[[1]]@description$SPILL) # Transform fluorescent channels trans <- estimateLogicle(gs[[4]], cyto_fluor_channels(gs)) gs <- transform(gs, trans) # Gate using gate_draw gt <- Activation_gatingTemplate gating(gt, gs)#>#>#>#>#>#>#>#>#>#>#>#>#>#>#>#>#>#>#>#>#>#>#>#>#>#>#>#>