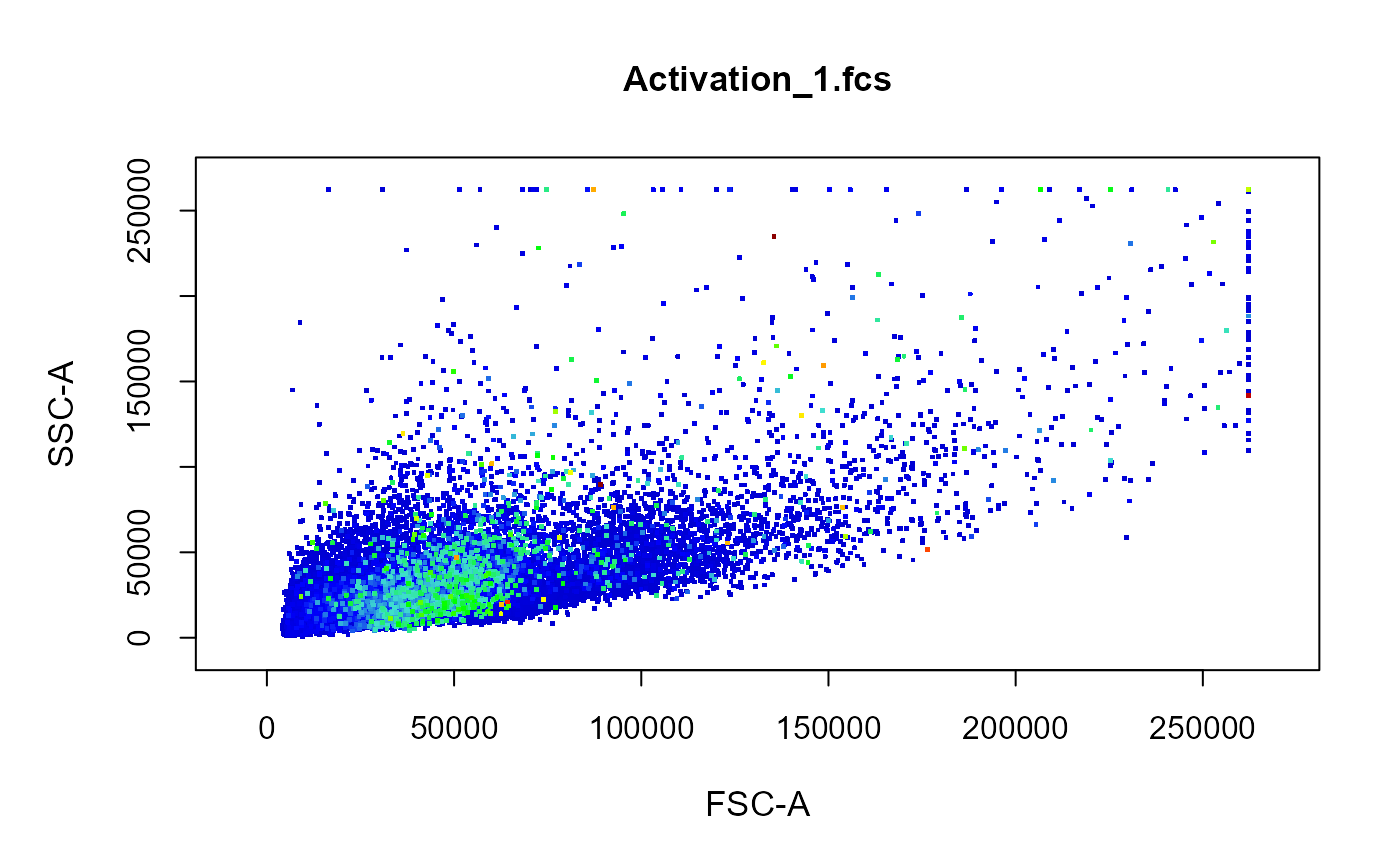
The density colour scale for points in cyto_plot can now be made to
represent fluorescent intensity of a third channel, instead of local density
in the 2D plotting space. In order for this feature to work properly, the
full range for the channel/marker of interest is required to appropriately
set the colour scale. cyto_calibrate performs this range calibration,
so that this information can be used in all downstream cyto_plot
calls.
cyto_calibrate(x, parent = "root", type = "range", probs = c(0.01, 0.99), ...)
Arguments
| x | object of class |
|---|---|
| parent | name of the parent population to use for channel calibration
when a |
| type | indicates the type of calibration to perform, options include
|
| probs | vector of lower and upper probabilities passed to
|
| ... | not in use. |
Value
saves calibration settings for use by cyto_plot.
Author
Dillon Hammill, Dillon.Hammill@anu.edu.au
Examples
library(CytoExploreRData)

# Activation flowSet
fs <- Activation

# Calibration
cyto_calibrate(fs)

# Colour based on Hoechst-405 staining
cyto_plot(fs[1],
channels = c("FSC-A", "SSC-A"),
point_col = "Hoechst-405")